"If my foresight were as clear as my hindsight, I should be better off by a damned sight."
"If my foresight were as clear as my hindsight, I should be better off by a damned sight."
IBM's Twenty-First Century Overview, Performance and Practices
IBM is one of the world’s most representative corporate social ecologies. If IBM were a city, its representation from more than 175 countries would make it one of the world’s most educated and ethnically diverse. Its population would place it in the top forty cities of the United States or Brazil, the top ten of Malaysia, the top five of France or the top two of Romania or Norway.
Employee Engagement as IBM Exited the Twentieth Century
|
From 1980 to 1985 this corporate metropolis expanded 19%, from 341,279 employees to 405,535. It then contracted over the next decade by 31% to 278,039. The strain of such a population drop on a corporate society can be understood in the visualization of an equivalent 30% loss (28.5%) in one metropolitan society: Detroit, Michigan, from 1990 to 2014.
An Internet search of the words "Detroit Decay" pictorially reflects how such population changes can alter not just the economic infrastructure of a city, but the psyche and social fabric of its people. If this picture of city decay had ever reflected the inner spirit of IBM’s employees, it would have taken decades to recover in the '90s.
|
IBM's Corporate Society Never Looked this Bad B.G. (Before Gerstner)
|
But in 1993, it only took a single year to turn the corporation around because—unlike what Louis V. Gerstner wrote in his self-evaluation "Who Says Elephants Can't Dance"—IBM's culture was still intact. IBM's employees were still engaged.
I can write this because I was there: "A View from Beneath the Dancing Elephant."
I can write this because I was there: "A View from Beneath the Dancing Elephant."
Employee Engagement as IBM Enters the Twenty-First Century
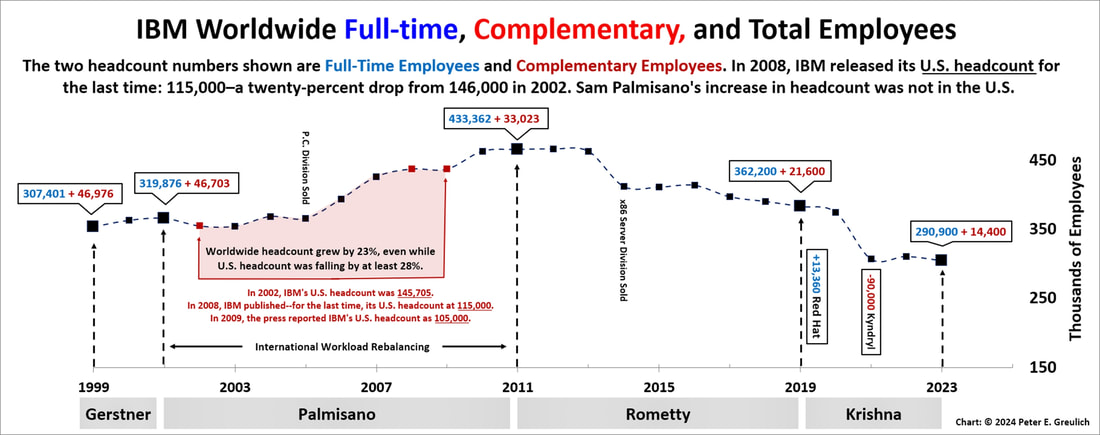
IBM's leadership has once again—under the premises of right sizing and workforce rebalancing—spiked and then slam dunked its workers around the world. IBM has been moving workloads to lower-wage countries for over two decades, obscuring these moves by limiting the employment information it releases to its shareholders and their societies within which it does business (see the shaded portion of the chart below). For some third-world countries it was a hiring boom time, while in the countries that had supported IBM for more than a century—through the Great Depression and two world wars, it was a bust.
From 1999 to 2012 IBM's employment grew by an astronomical 32% to a historic peak of 466,995 employees. Since 2012, the number of employees has plummeted by 35% to 305,000 employees in 2023—one out of every three employees is gone. Meanwhile, the corporation becomes ever more opaque: it has failed to publish its U.S. employment numbers since 2008.
From 1999 to 2012 IBM's employment grew by an astronomical 32% to a historic peak of 466,995 employees. Since 2012, the number of employees has plummeted by 35% to 305,000 employees in 2023—one out of every three employees is gone. Meanwhile, the corporation becomes ever more opaque: it has failed to publish its U.S. employment numbers since 2008.
Since the end of 2011, IBM has jettisoned at least 158,000+ employees—most in high-wage countries, with 51,000 being released in 2014 alone. This was the year the company sold the x86-Server Division. Then, with the Kyndryl divestiture in 2021, IBM's full-time equivalent headcount fell 67,700.
IBM's employment number of 305,300 in 2023 was last equaled in the "Crisis of 1993-96" and before that in 1976.
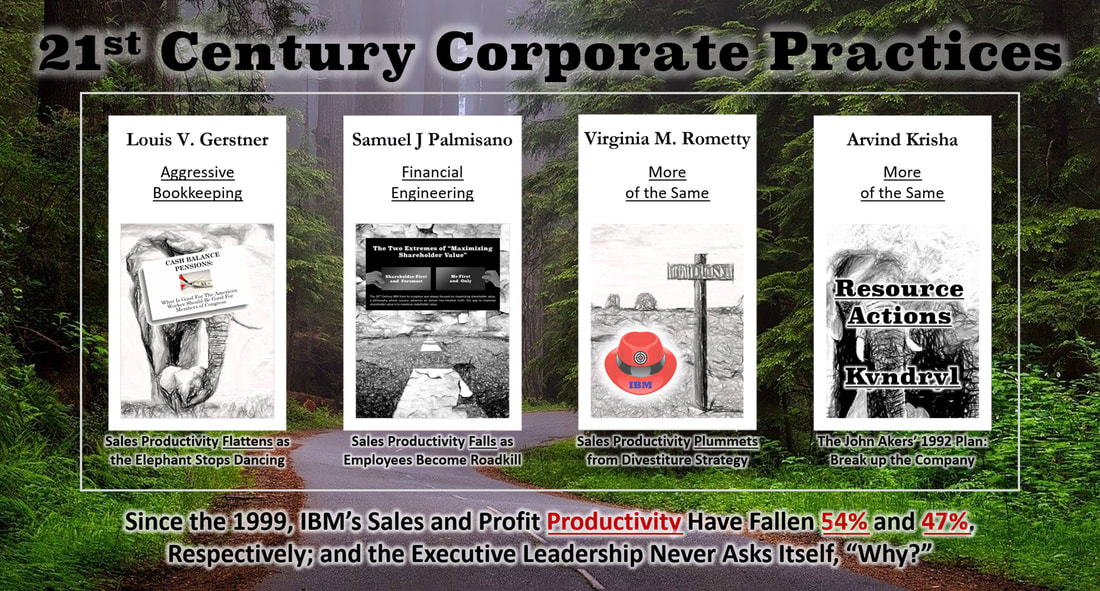
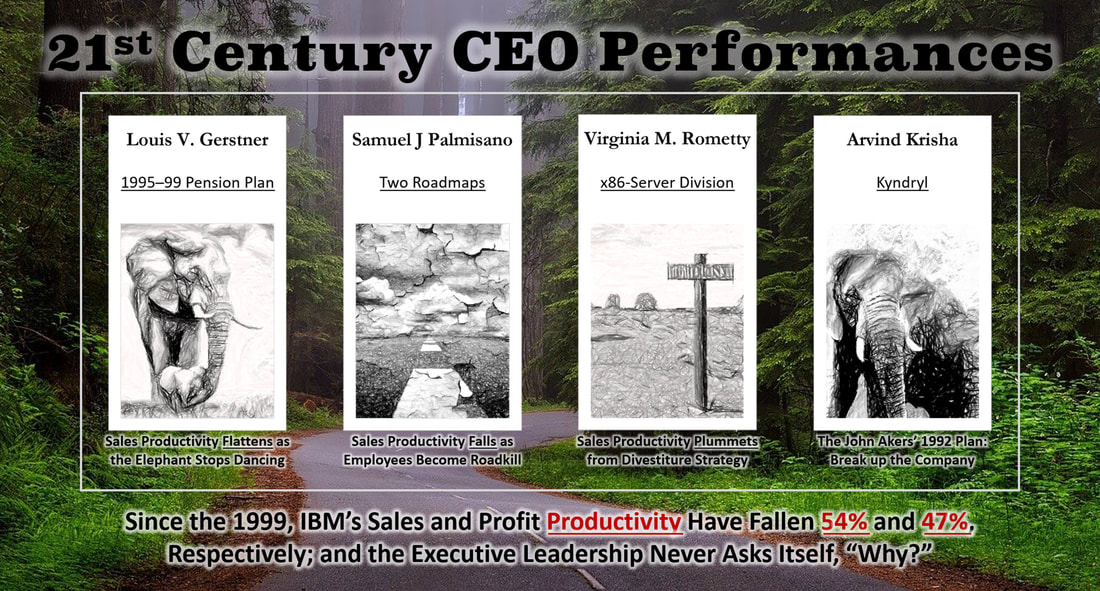
The strain these changes have put on the corporation's social infrastructure is again unimaginable and is reflected in a continuous fall in sales and profit productivity. Since 1999, adjusted for inflation, individual sales and profit productivity are down 55% and 47%, respectively [Sales productivity graph: here and Profit productivity graph: here]. Every one of the over 300,000 employees are producing 50% less revenue and profit. No matter what its chief executives say, the data speaks volumes: IBM's twenty-first-century employees are no longer engaged.
|
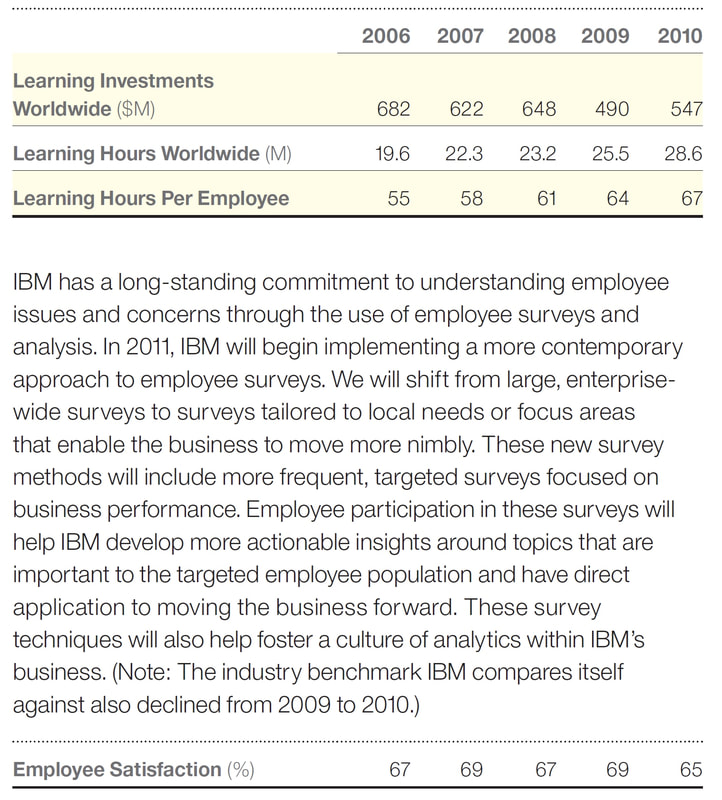
This is why the corporation has not published anything resembling an overall, audited, corporate-wide engagement number since 2011. Virginia M. Rometty dropped this vital statistic from IBM's Annual Reports/Corporate Responsibility Reports, and Arvind Krishna in IBM's 2021 Annual Report inserted the following meaningless marketing fluff about voluntary turnover:
Voluntary attrition was higher in 2021 than in 2020 consistent with the overall labor market. On a longer horizon, the average voluntary attrition rate of the pandemic years (2020 and 2021) was still lower than the previous two years (2018 and 2019). This statement was followed in IBM's 2023 Annual report with the following information that lacked any supporting data for an analyst or a shareholder to draw any significant conclusions about voluntary turnover rates at the corporation: just that it "decreased," but with no supporting information to know what the percentage was and what it currently is.
|
This report showing employee satisfaction/engagement was last published in IBM's 2010 Corporate Responsibility Summary Report
|
In 2023, voluntary attrition decreased when compared to each of the past two years.
Thus it is that IBM's executive team fails its own promise of transparency: "What is the internal overall morale of the employees in the corporation?" Virginia (Ginni) M. Rometty eliminated the possibility of tracking it in 2011 and Arvind Krishna is not providing this information to his stakeholders in any detailed, audited way.
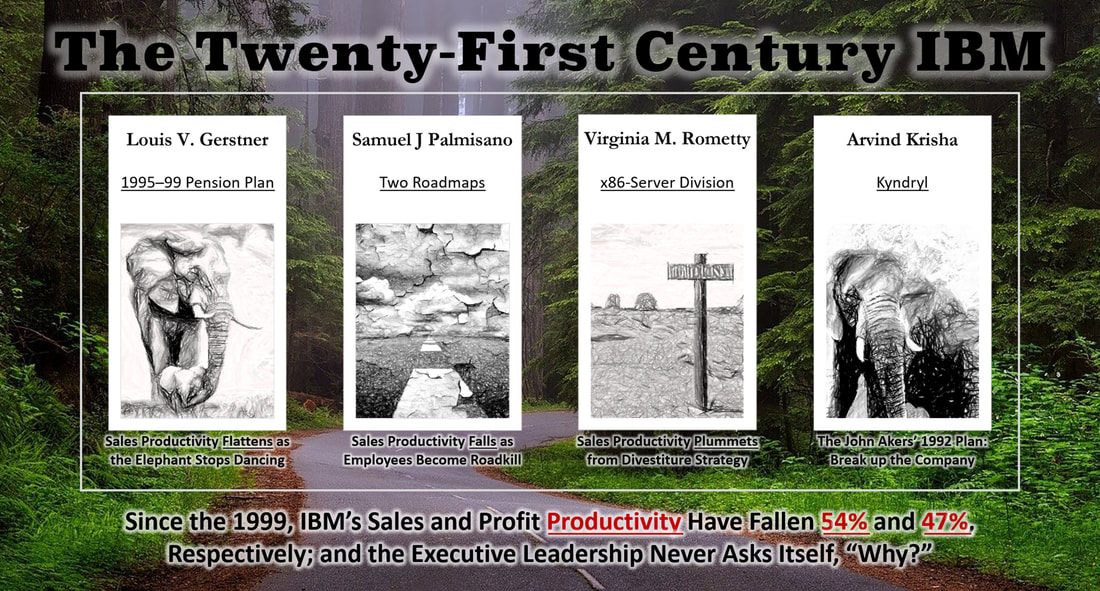
The stories in this section can be accessed from the "21ST CENTURY IBM" menu above or by selecting one of the menu buttons below which are supported with additional descriptive text.
IBM's Twenty-First Century Performance and Practices
|
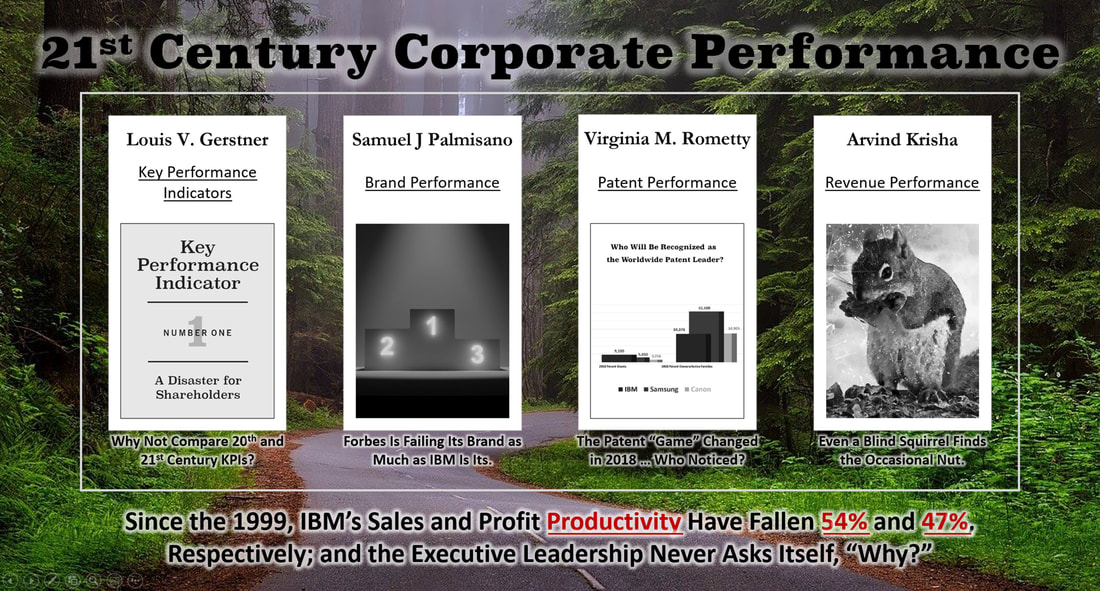
There are articles on: IBM's 21st Century Brand, Patent and Revenue Performances.
|
|
Other topics include: (1) "Has IBM Maximized or Minimized Shareholder Value," (2) "How Has IBM's Acquisition Strategy Affected Shareholder Risk," and (3) "How Has Workforce Rebalancing Impacted Employee Productivity," and others.
|
|
This section provides detailed performance results for Arvind Krishna and Virginia M. (Ginni) Rometty.
It includes but is not necessarily limited to: (1) Market Value, (2) Shareholder Returns and Risk, (3) Share Buybacks, (4) Employment Security, and (5) Revenue and Profit Growth and Productivity. |
