Shareholder Returns by IBM CEO
Overview of these Chief Executive Officer Performance Pages
|
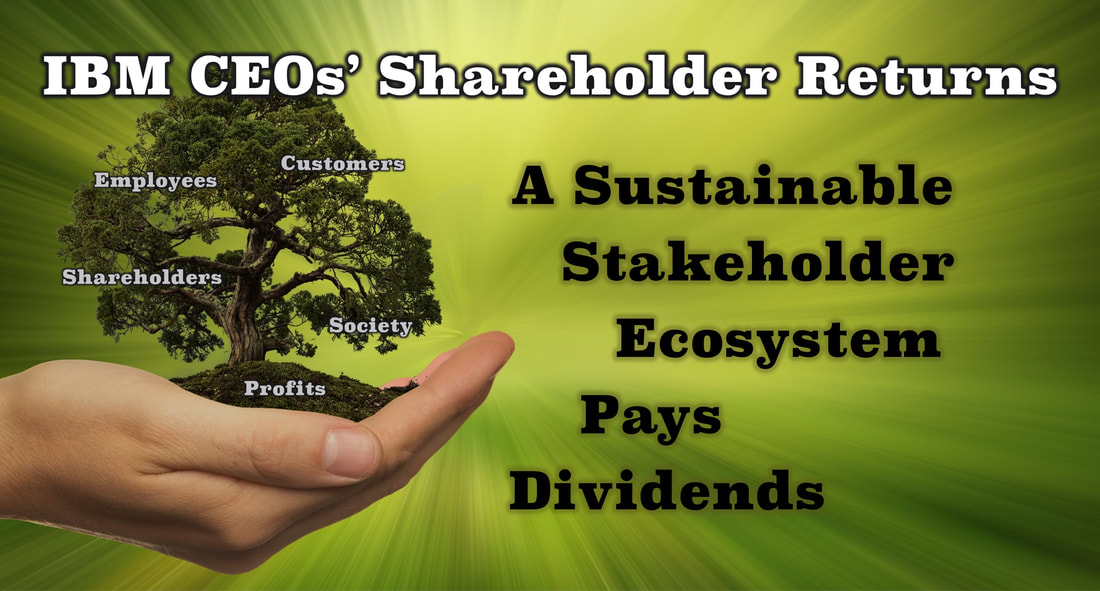
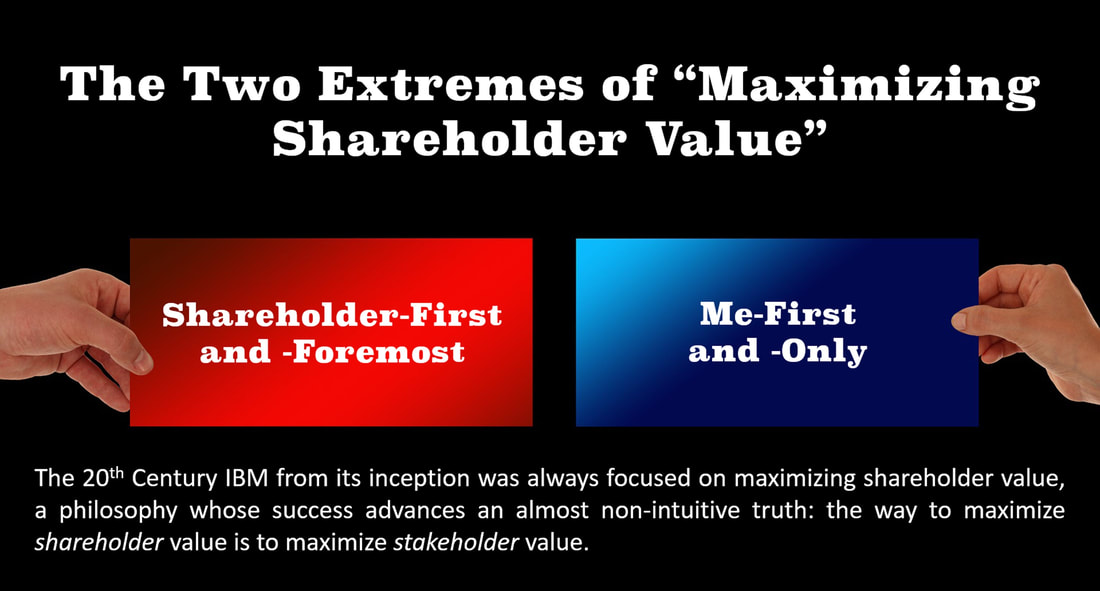
Today, there is a raging debate among corporate stakeholders as to the wisdom of Wall Street's shareholder maximization fanaticism. This is what I call in my latest book: shareholder-first and -foremost, or me-first and -only. Tom Watson Sr. fought both of these philosophies in his time as chief executive. In fact he worked to ensure that all his stakeholders—his customers, employees, shareholders and societies—were members of a supportive stakeholder ecosystem. The returns of IBM's shareholders were the greatest when this ecosystem was functioning properly. That will be evident in these charts.
|
Tom Watson Sr. believed in "Two-Way Streets."
|
Let's start this evaluation of IBM's Chief Executive Officers with their historical shareholder returns. These charts assume the purchase of $1,000 of IBM stock on the first of the year each CEO assumed control and ending with their last full year in the corner office.
One major obstacle was to find a reliable, consistent, one-hundred-year benchmark to compare the shareholder returns of IBM's Chief Executive Officers. We are using Morningstar's® IA SBBI US Large Stock: Total Returns (previously Ibbotson's® Stocks, Bonds, Bills, and Inflation® (SBBI) Classic Yearbook). This information is available through Morningstar's Advisor Workstation. There may be more representative, individual benchmarks at times—such as technology stocks during Louis V. Gerstner's tenure; but the decision was made in this evaluation to prioritize historical comparative consistency over the anomalies of one particular period. Significant economic and political considerations are highlighted beneath each chart as facts worth noting.
One major obstacle was to find a reliable, consistent, one-hundred-year benchmark to compare the shareholder returns of IBM's Chief Executive Officers. We are using Morningstar's® IA SBBI US Large Stock: Total Returns (previously Ibbotson's® Stocks, Bonds, Bills, and Inflation® (SBBI) Classic Yearbook). This information is available through Morningstar's Advisor Workstation. There may be more representative, individual benchmarks at times—such as technology stocks during Louis V. Gerstner's tenure; but the decision was made in this evaluation to prioritize historical comparative consistency over the anomalies of one particular period. Significant economic and political considerations are highlighted beneath each chart as facts worth noting.
But shareholder returns shouldn't be the only measurement. How do you decide if a CEO just happened to be at "the right place at the right time," or did they transcended the economic, political and competitive pressures of their decade(s) to achieve long-term success?
Louis V. Gerstner's self-evaluation Who Says Elephants Can't Dance? fails to raise or answer any of these longer-term questions about his time as chief executive (which, of course, wasn't the purpose of his book):
|
|
It takes a holistic perspective and this is just a starting point. More information follows to provide a more complete picture of each CEO's tenure. These pages will be updated as our studies continue and more current information becomes available.
Enjoy the journey. Let's start with shareholder returns.
Cheers
- Peter E.
Enjoy the journey. Let's start with shareholder returns.
Cheers
- Peter E.
IBM Chief Executive Officers' Shareholder Returns
Summary of CEO Shareholder Returns
- 30.03% CAGR in IBM Stock over 9 years: Louis V. (Lou) Gerstner
- 20.96% CAGR in IBM Stock over 15 years: Thomas J. Watson Jr.
- 16.69% CAGR in IBM Stock over 32 years: Thomas J. Watson Sr.
- 16.05% CAGR in IBM Stock over 4 years: John R. Opel
- 12.47% CAGR in IBM Stock over 2 years: T. Vincent (Vin) Learson
- 5.66% CAGR in IBM Stock over 10 years: Samuel J. (Sam) Palmisano
- -.72% CAGR in IBM Stock over 8 years: Virginia M. (Ginni) Rometty
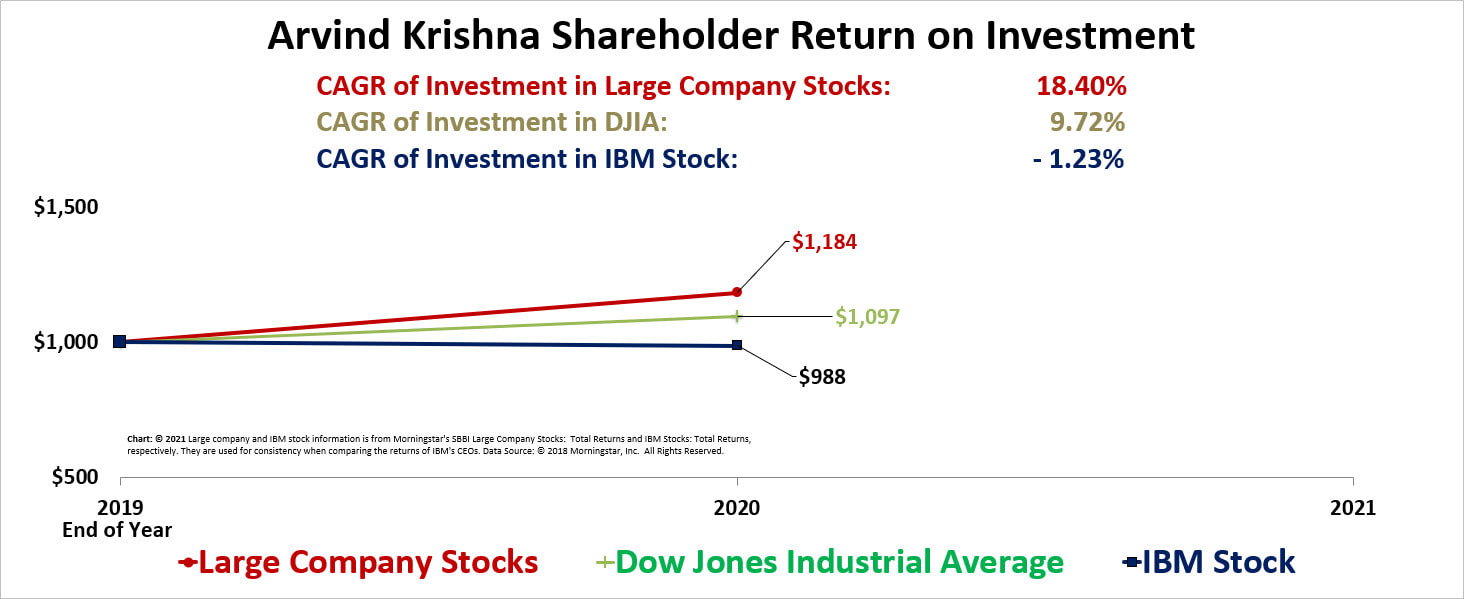
- -1.23% CAGR in IBM Stock over 1 year: Arvind Krishna
- -2.10% CAGR in IBM Stock over 8 years: Frank T. Cary
- -7.26% CAGR in IBM Stock over 8 years: John F. Akers
|
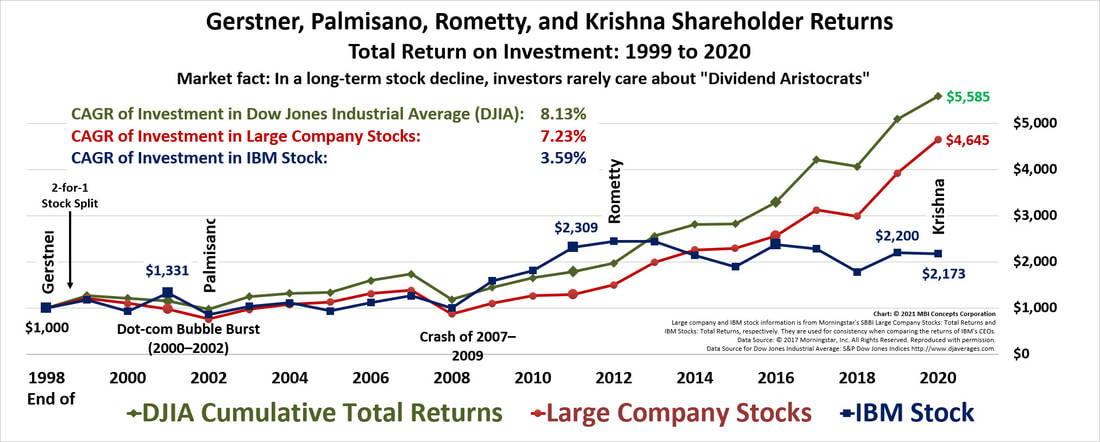
At a Glance: Examining the Last Two Decades of Shareholder Returns: 1999 – 2020 |
- Investment in IBM Stock: 3.59% CAGR
- Investment in Large Company Stocks: 7.23% CAGR
- Investment in Dow Jones Industrial Average: 8.13% CAGR
|
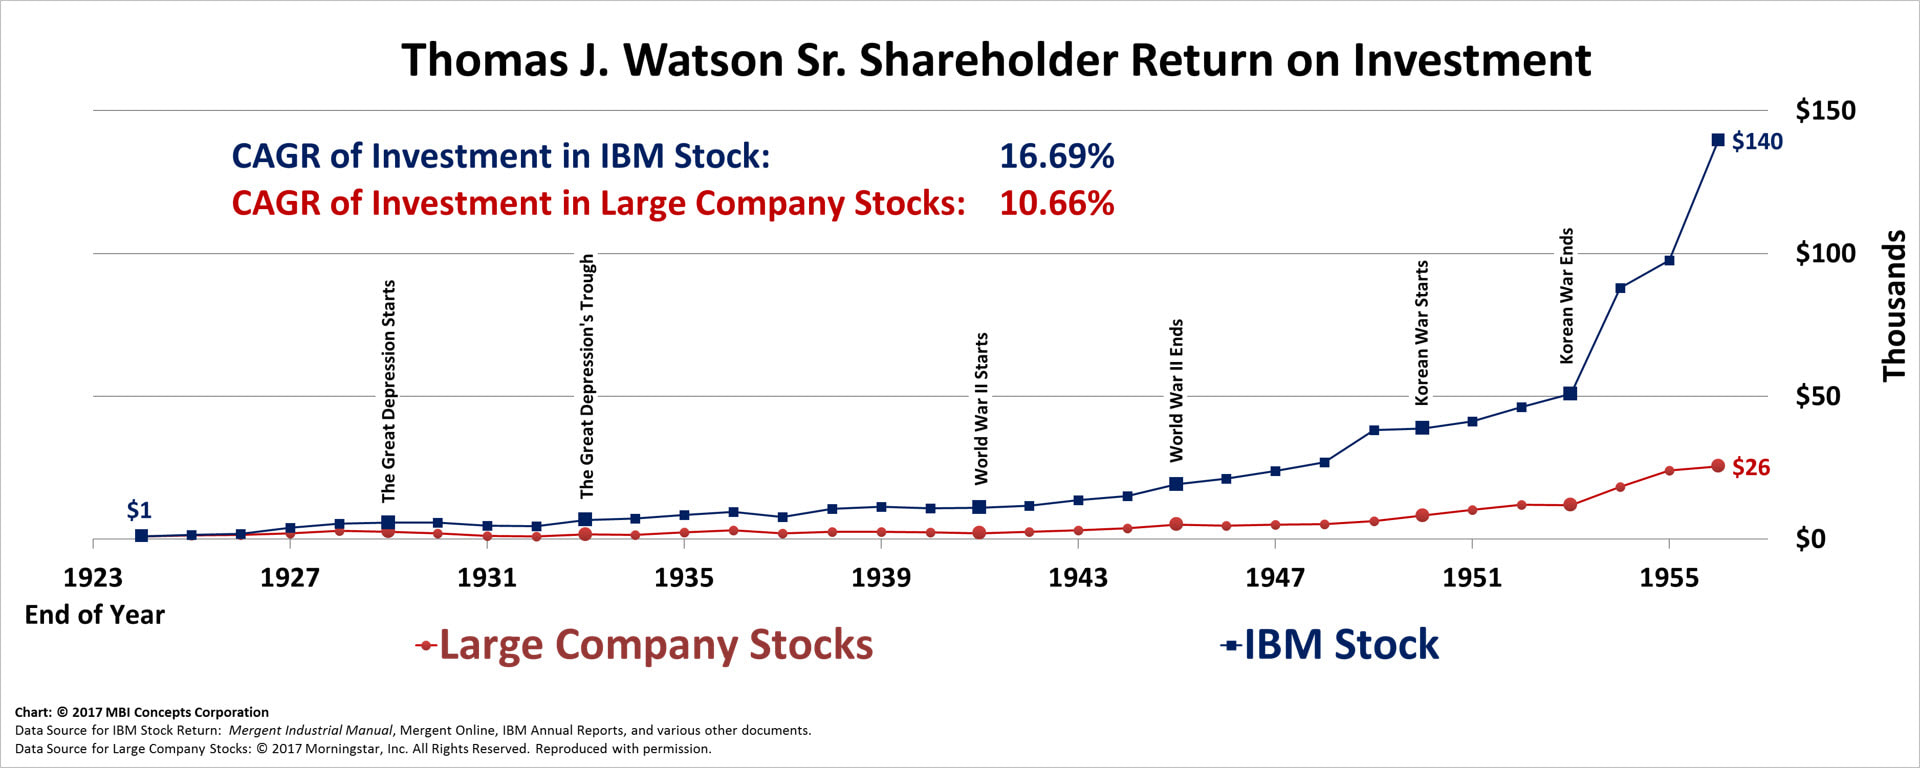
- Thomas J. (Tom) Watson Sr.: May 1914 – May 1956 |
- Investment in IBM Stock: 16.69% CAGR
- Investment in Large Company Stocks: 10.66% CAGR
Facts worth noting: The above returns are from 1923 through 1956—over three decades. The IBM Corporation documented, at the time of Watson Sr.'s death, that a purchase of 100 shares in 1914 (when Watson Sr. assumed control of IBM as the C-T-R Company) would have cost less than $3,000. By the time of his death, this would have become 4,987 shares with a market value of $2,274,072 (at $456 per share). This presumably (the article did not state this specific detail) included reinvestment of dividends. This is a CAGR of 17.10% over his full forty-two years leading IBM. Watson Sr. faced five recessions, the Great Depression and then four more recessions; he faced four of the six top U.S. stock market declines; and he also navigated the corporation through World Wars I, II and the Korean War.
|
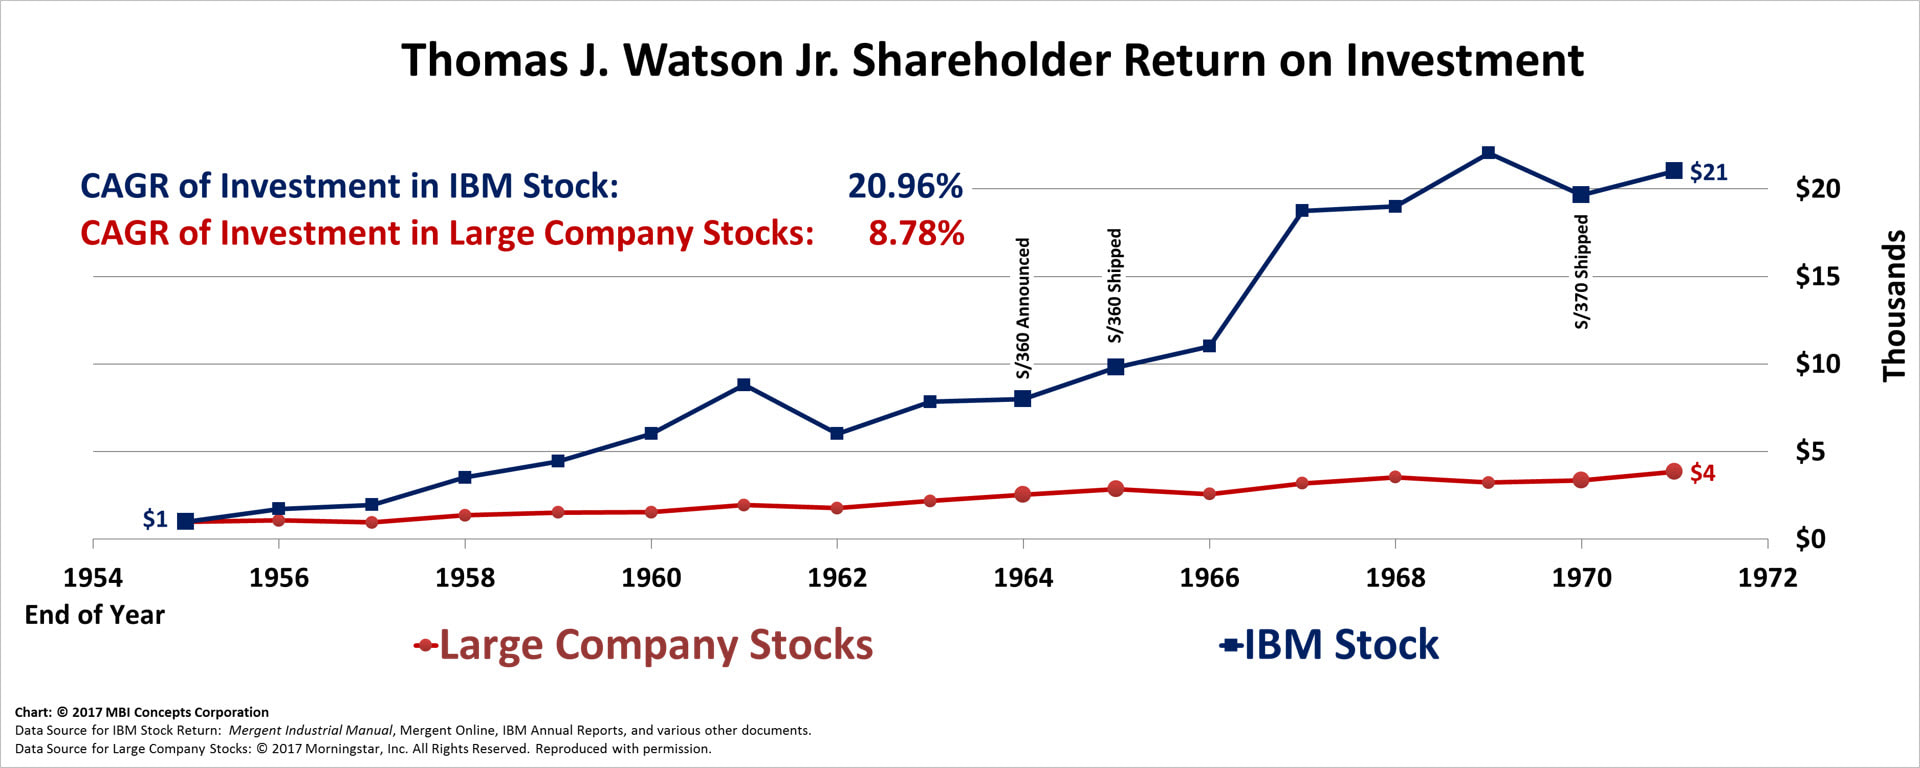
- Thomas J. (Tom) Watson Jr.: Jun 1956 – May 1971 |
- Investment in IBM Stock: 20.96% CAGR
- Investment in Large Company Stocks: 8.78% CAGR
Facts worth noting: Watson Jr. completely changed the organizational structure and accountability model of IBM in 1956 when he took charge. He decentralized IBM and instituted a cultural identity throughout the corporation with three words: Respect, Service and Excellence. This change enabled him to accomplish the following: Internationally, at the beginning of 1956, corporate employment stood at 56,000, revenue at $700 million, and net income at $73 million. Rather than taking another four decades to match those numbers, Watson Jr. added, on average, 56,000 employees every four years, $700 million in revenue every year and a half, and $73 million in net income almost every year. By 1971, revenue per employee had grown by 150%, net income per employee by more than 200%, and the number of stockholders by more than 2,000%.
|
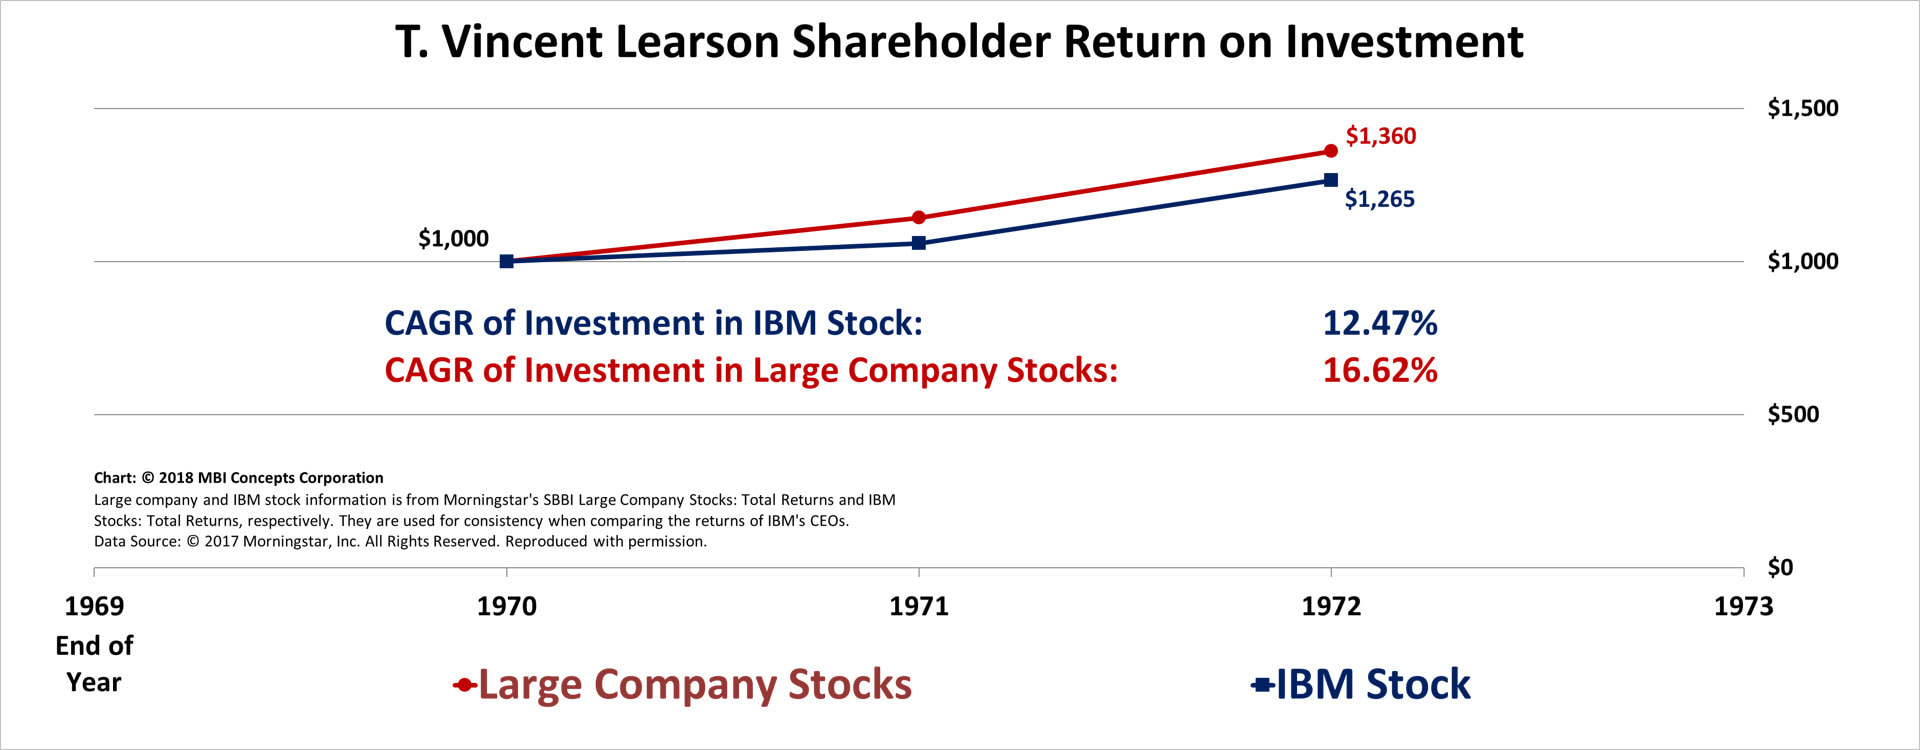
- T. Vincent (Vin) Learson: Jun 1971 – Dec 1972 |
- Investment in IBM Stock: 12.47% CAGR
- Investment in Large Company Stocks: 16.62% CAGR
Facts worth noting: T. Vincent Learson should be considered Thomas J. Watson Jr.'s second in command and acerbic touchstone for the entire time he was Chief Executive at IBM - including the development of the mainframe. So, although this chart above shows the returns during his 18 months as chief executive, it is a microscopic part of the overall impact he had on overall shareholder returns.
|
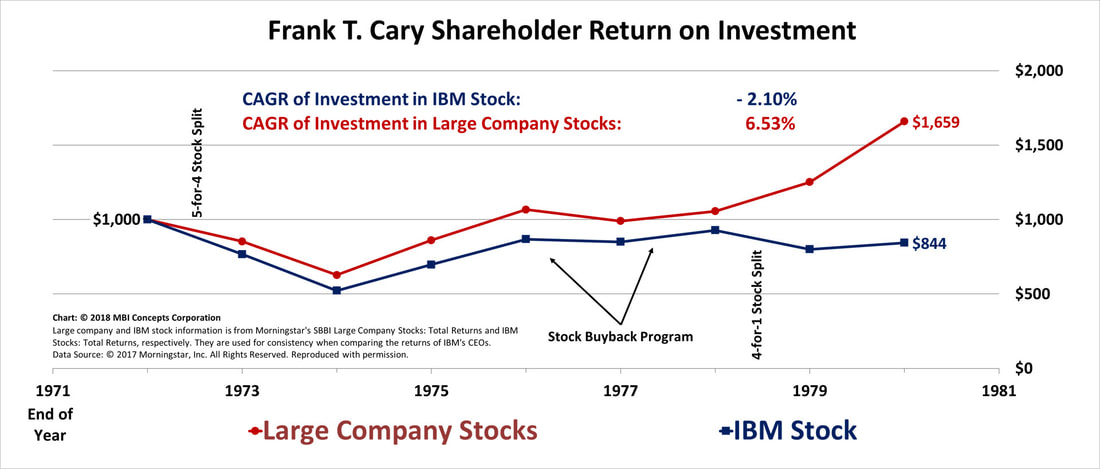
- Frank T. Cary: Jan 1973 – Dec 1980 |
- Investment in IBM Stock: - 2.10% CAGR
- Investment in Large Company Stocks: 6.53% CAGR
Facts worth noting: Frank Cary faced the most tumultuous of decades in IBM's history. This decade was earmarked by three Category Five storms in the economic, political and competitive arenas. It started with a massive investment failure in the Future Systems project. Mr Cary, with John R. Opel at his side, lost focus on managing the company by attempting to manage the stock: a 5-for-4 stock split, a first-time stock buyback program, and then a 4-for-1 stock split to supposedly increase the appeal of the stock to small investors. This was balanced, though, with a significant investment in corporate assets to take on the "Japanese threat" of the '70s. A great showing by a great chief executive only marred by stock-price experimentation that ultimately proved unsuccessful and should have served as a warning for the current 21st Century CEOs.
|
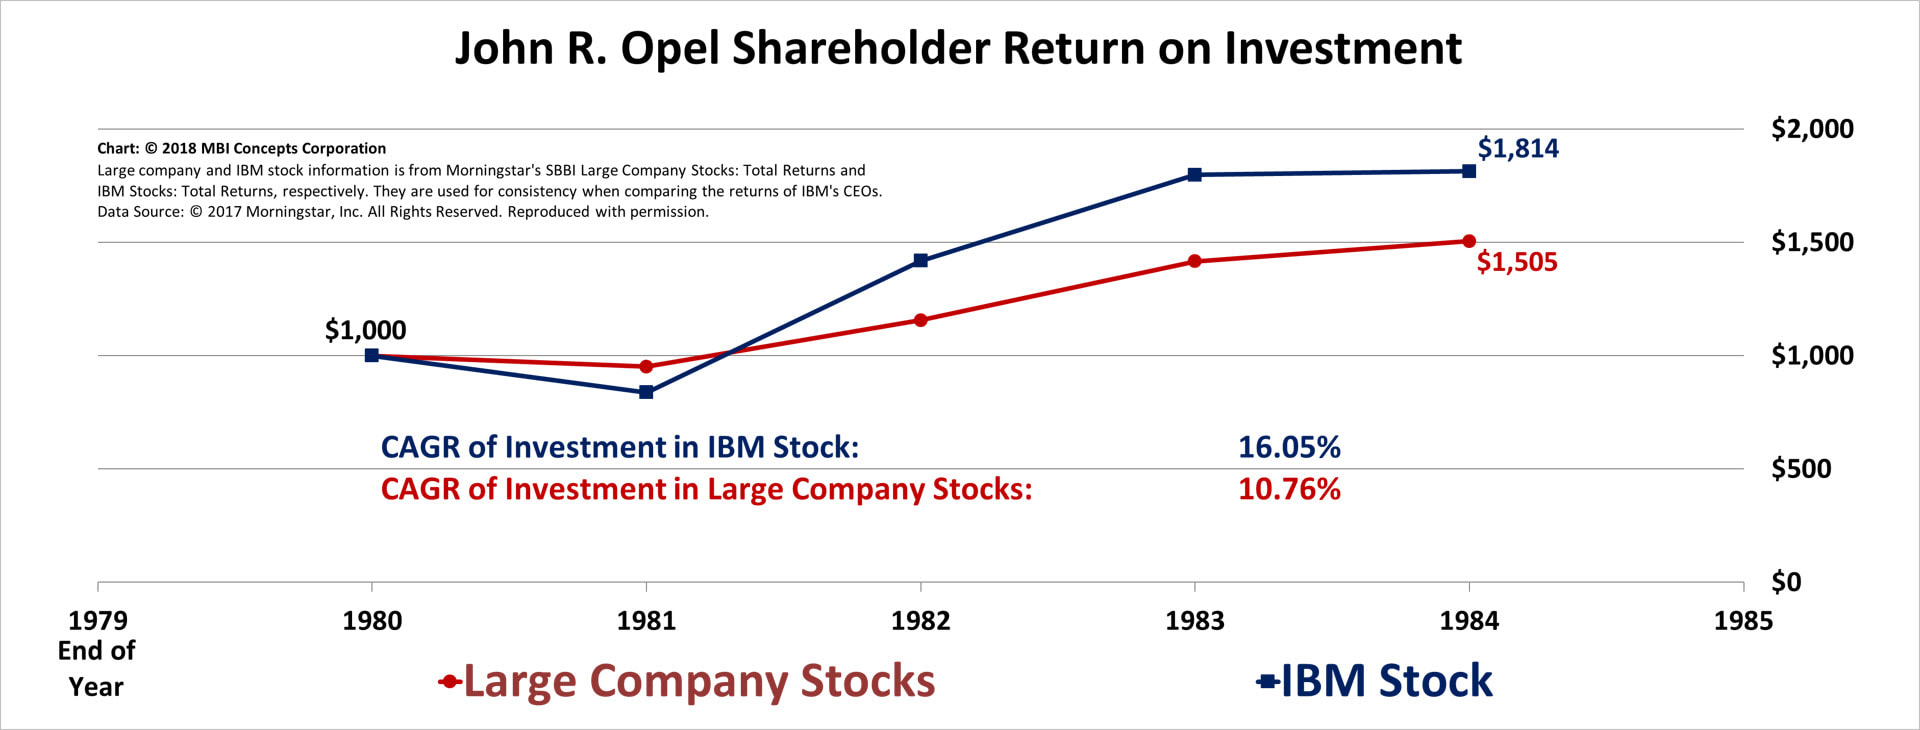
- John R. Opel: Jan 1981 – Jan 1985 |
- Investment in IBM Stock: 16.05% CAGR
- Investment in Large Company Stocks: 10.76% CAGR
Facts worth noting: John R. Opel is the chief executive that set John F. Akers up for failure. One should not feel too much sympathy for John Akers, though, because he: (1) failed to react timely to change the corporation's direction after assuming control and (2) was on the board of directors when Mr. Opel sold off IBM's complete install base of lease/rental machines that put IBM on a "purchase only" footing. John Opel should be remember for replacing an annual, $1 gold piece with a one-time, devalued $2 paper note. This was a fire sale, pulling in revenue and profits from out years. It was financial engineering—following a short-term, financially expedient path at the expense of the long-term health of the business.
|
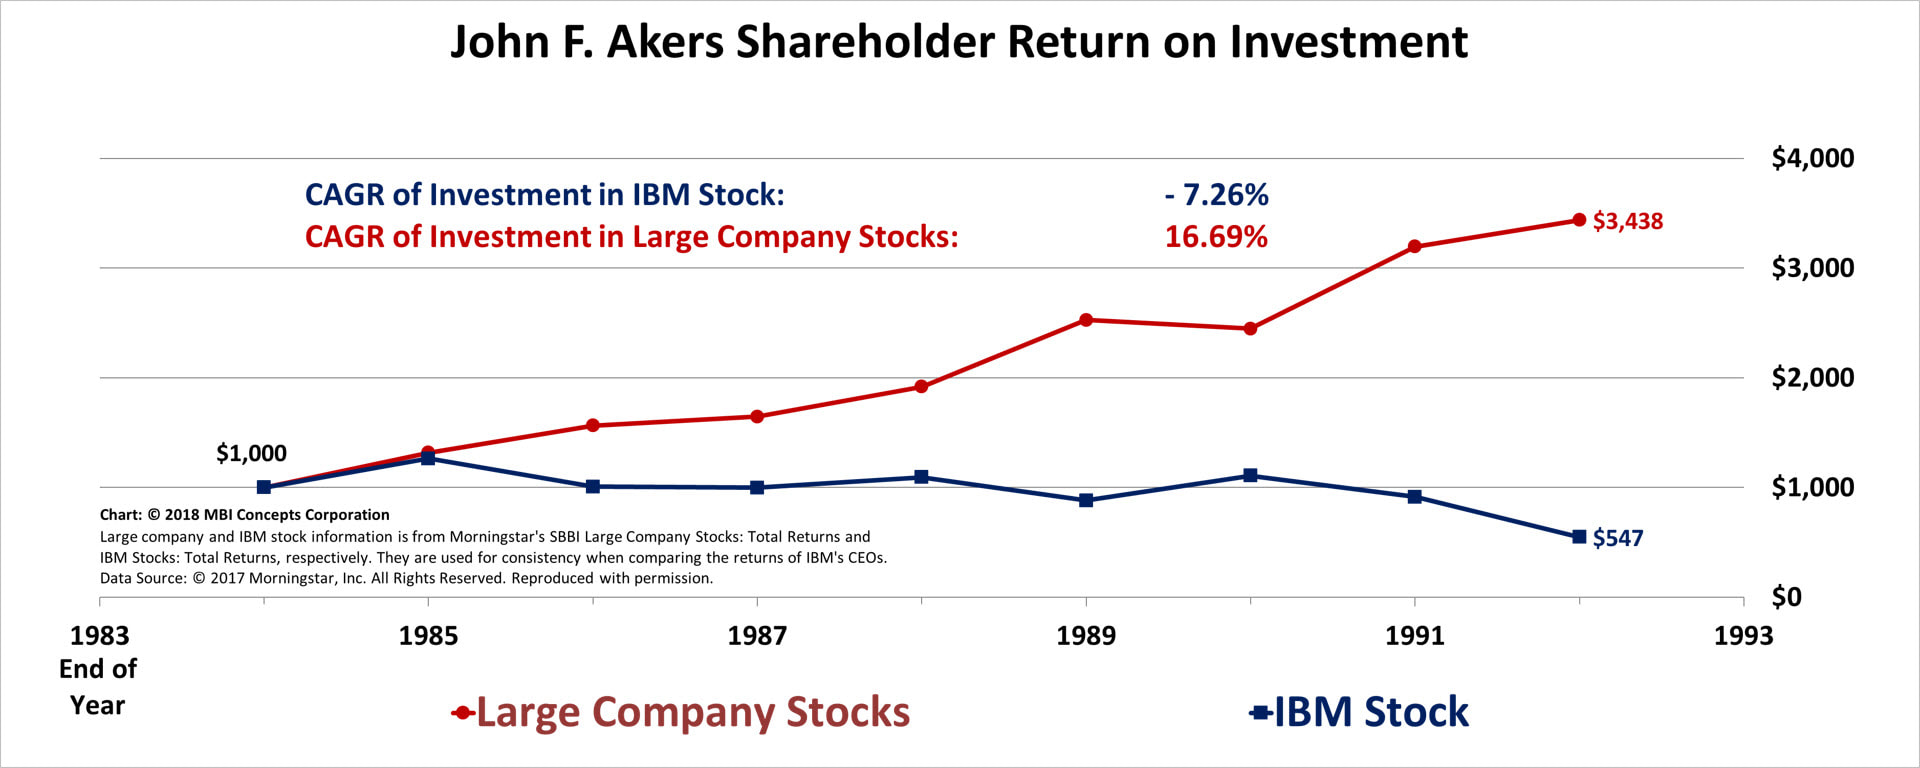
- John F. Akers: Feb 1985 – Mar 1993 |
- Investment in IBM Stock: - 7.26% CAGR
- Investment in Large Company Stocks: 16.69% CAGR
Facts worth noting: John F. Akers is the man remembered for the fall of IBM in the '90s. His predecessor, though, set up this fall by setting unreasonable market expectations and spending money as if they could be met. He talked of the $100 billion IBM by 1990 and $180 billion IBM by 1994. These were expectations founded on financial engineering that took place in the previous four years. With less than six months in the corner office, John Akers had to tell analysts that these expectations could not be realized. When he did, "two wire-service reporters quietly slipped out of the room, breaking into a run once they were out of earshot. A half-hour later … IBM’s stock had started to plummet. By day’s end it was down five points, taking the entire stock market with it … the next day the market dropped another 16 points.” It would have taken a chief executive of the caliber of one of the Watsons or a Frank Cary to have overcome such a start as chief executive.
|
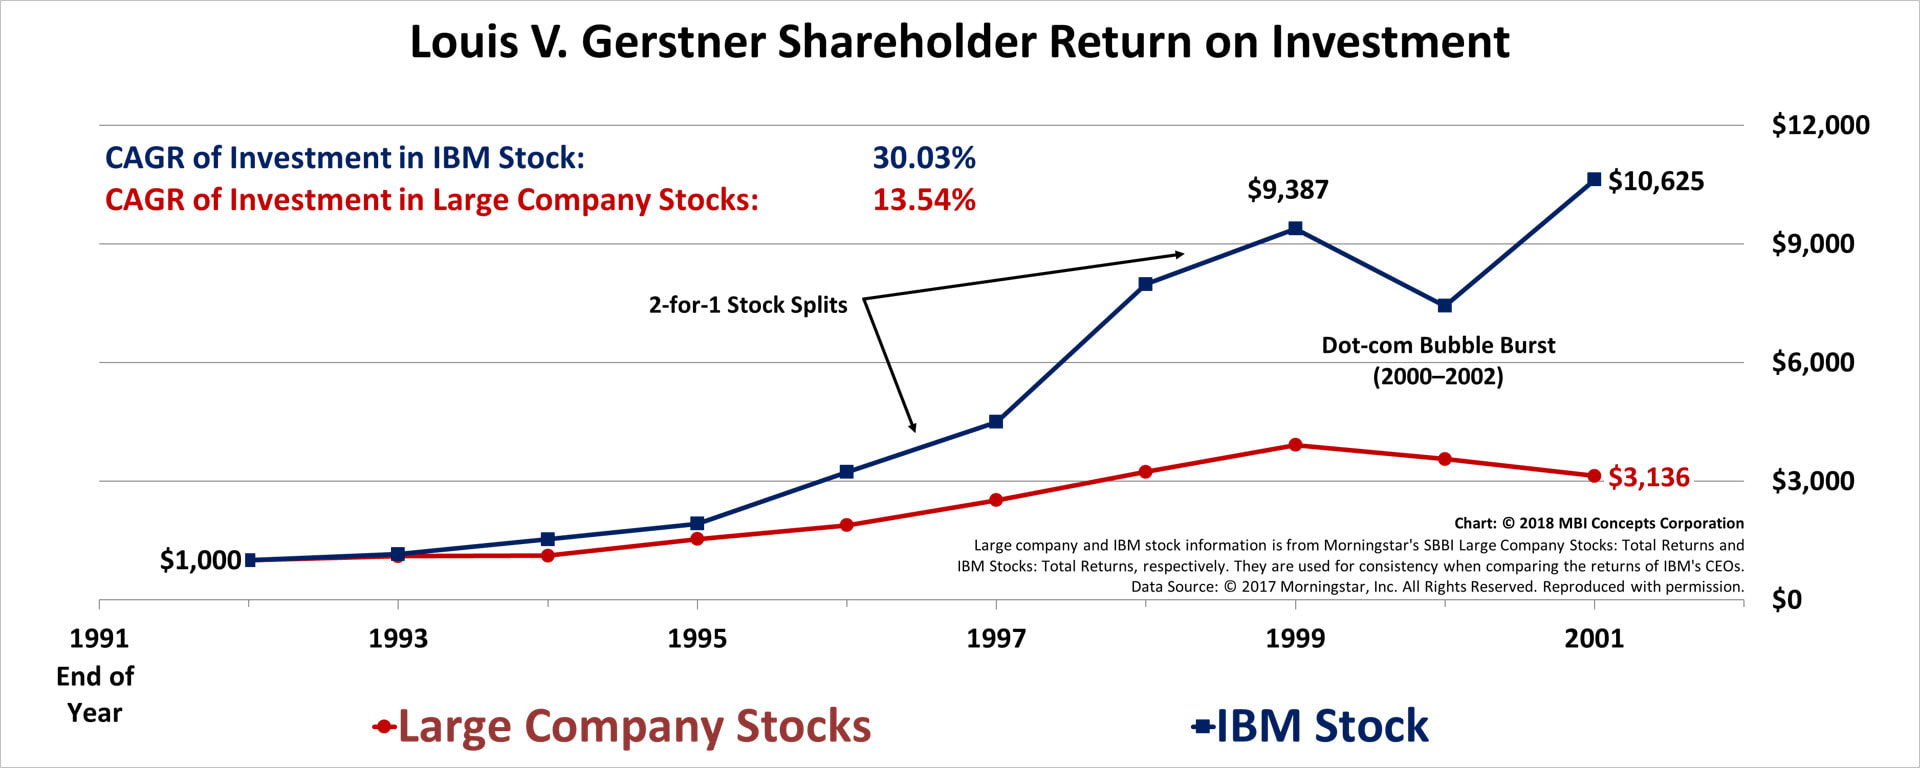
- Louis V. (Lou) Gerstner: Apr 1993 – Feb 2002 |
- Investment in IBM Stock: 30.03% CAGR
- Investment in Large Company Stocks: 13.54% CAGR
Facts worth noting: Although the CAGR of IBM stock at 30.03% looks fabulous compared to the 13.54% return of our benchmark, one-hundred-year, consistent, cross-industry Morningstar IA SBBI US Large Company Stocks, it should be noted that the Dow Jones U. S. Technology Index (DJUSTC) from 1992 to 1999 yielded $12,503 to IBM's $9,387. Over the first seven years of this chart, this is a CAGR of 43.46% for technology stocks compared to IBM's 37.70%. Should IBM be considered a large company stock or a technology stock during this technology bubble from 1992 through 1999?
At a minimum, historians should be aware that IBM outperformed large company stocks but under performed within its peer group of technology stocks. Louis V. Gerstner states his case to be the greatest of IBM chief executives in Who Says Elephants Can't Dance?. This self-evaluation though leaves out too much to be considered an unbiased and complete evaluation of Mr. Gerstner's tenure in the corner office. He fails to: (1) document how the longest and strongest expansion in the history of the United States served as an economic tailwind for his nine years, (2) give credit to an old culture that wasn't dead but hibernating and re-emerged in 1993 to pull the company from the abyss of economic destruction, (3) fully understand how his pension actions in 1995 and 1999 destroyed a culture he never used to his long-term advantage as employee revenue and net income productivity start an eighteen year decline in 1999, (4) stop the quarterly resource actions he called "Chinese water torture" in 1993 as he told the press he would, and (5) finally, just a year after an $8 billion loss in 1993, he initiates stock buybacks that are the logical genesis for the earnings-per-share roadmaps of his successors (Palmisano and Rometty) in the following decade.
At a minimum, historians should be aware that IBM outperformed large company stocks but under performed within its peer group of technology stocks. Louis V. Gerstner states his case to be the greatest of IBM chief executives in Who Says Elephants Can't Dance?. This self-evaluation though leaves out too much to be considered an unbiased and complete evaluation of Mr. Gerstner's tenure in the corner office. He fails to: (1) document how the longest and strongest expansion in the history of the United States served as an economic tailwind for his nine years, (2) give credit to an old culture that wasn't dead but hibernating and re-emerged in 1993 to pull the company from the abyss of economic destruction, (3) fully understand how his pension actions in 1995 and 1999 destroyed a culture he never used to his long-term advantage as employee revenue and net income productivity start an eighteen year decline in 1999, (4) stop the quarterly resource actions he called "Chinese water torture" in 1993 as he told the press he would, and (5) finally, just a year after an $8 billion loss in 1993, he initiates stock buybacks that are the logical genesis for the earnings-per-share roadmaps of his successors (Palmisano and Rometty) in the following decade.
|
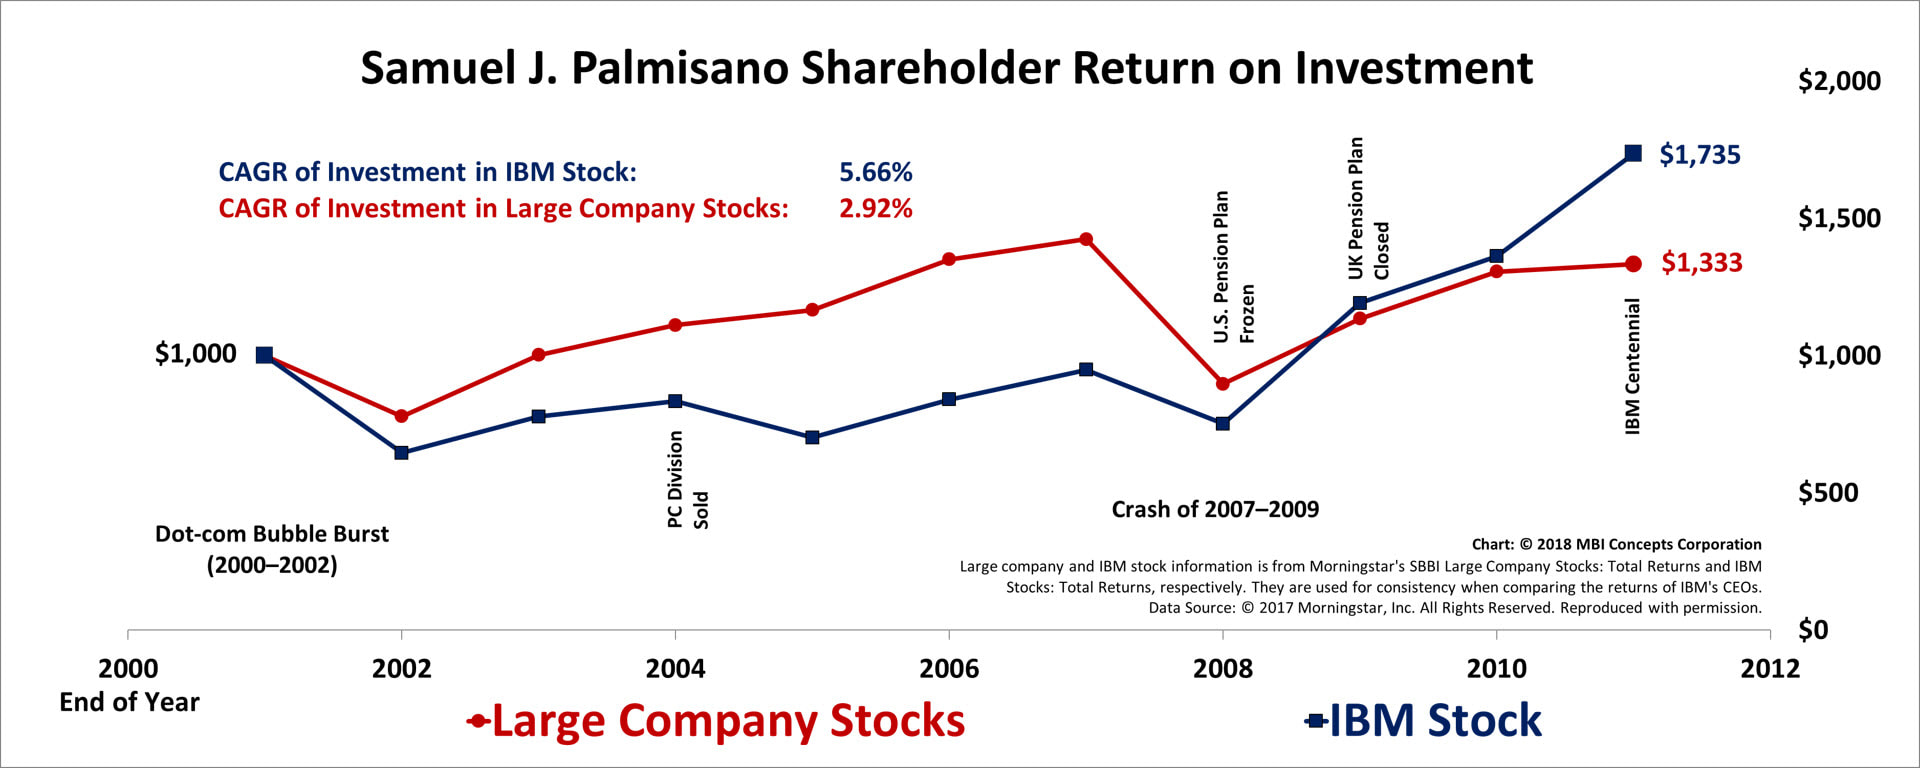
- Samuel J. (Sam) Palmisano: Mar 2002 – Dec 2011 |
- Investment in IBM Stock: 5.66% CAGR
- Investment in Large Company Stocks: 2.92% CAGR
Facts worth noting: Samuel J. Palmisano invested on average $10 billion a year in stock repurchases over his tenure as Chief Executive. Yet an investor for nine of his ten years would have made more money or achieved an equivalent return with less risk in a large company stock index fund. He followed in the steps of his predecessor: a chief executive who failed to manage by wandering around (MBWA). As I traveled the world, I would ask salesmen what they though of Sam Palmisano. Usually the reply, made in a satirical tone of voice, was something of the nature, "Sam who?" This was a man that the press called one of IBM's most capable salesmen, yet if they had dug just a little deeper they would have known that, by now, all IBM salesmen had lost respect for their corner office as their Salesman-in-Chief. The defining moment of his tenure as chief executive: an undying commitment to two earnings-per-share roadmaps rather than making business investments. Employees commented internally, "We are just roadkill on the roadside of these roadmaps."
|
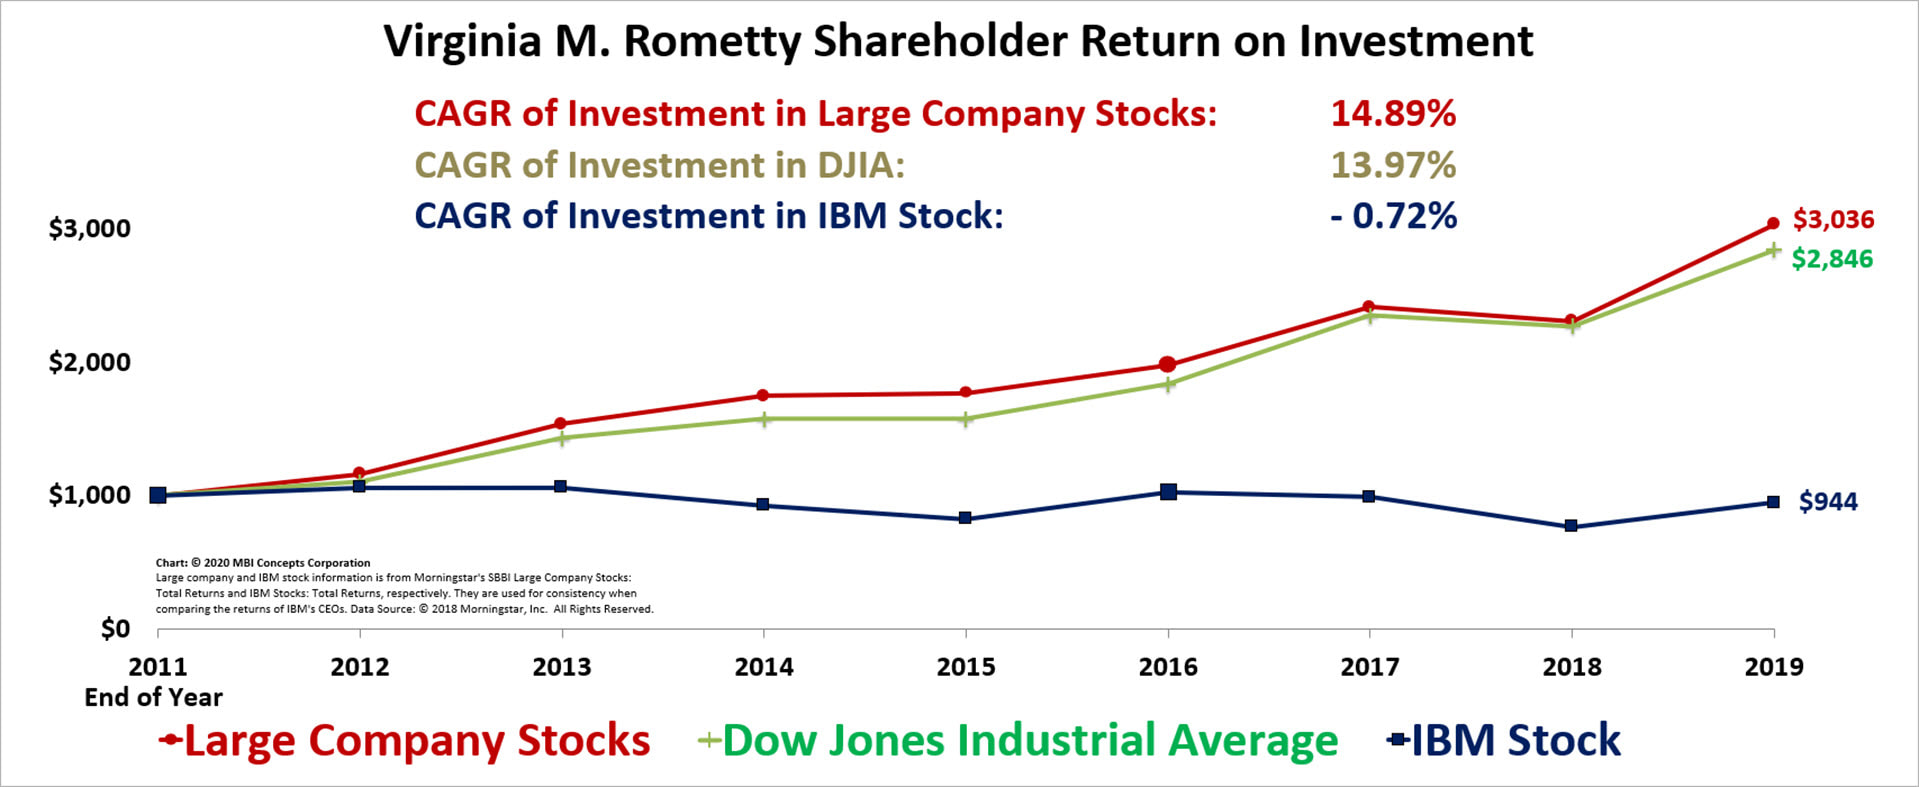
- Virginia M. (Ginni) Rometty: Jan 2012 – Mar 2020 |
- Investment in IBM Stock: -.72% CAGR
- Investment in Large Company Stocks: 14.89% CAGR
- Investment in Dow Jones Industrial Average: 13.97% CAGR
Facts worth noting: Virginia M. Rometty policies were the policies of her predecessors: (1) on-going, quarterly resource actions to increase earnings, (2) failure to understand the required connection between sales' requirements and product development to produce products of higher value for her customers, (3) managing the stock price rather than the business by investing critical profit dollars in paper rather than technology--on average, $7.2 billion a year in stock buybacks from 2012 to 2019. Detailed performance information for Virginia M. (Ginni) Rometty is: [here].
|
- Arvind Krishna: Apr 2020 – Present |
- Investment in IBM Stock: -1.23% CAGR
- Investment in Large Company Stocks: 18.40% CAGR
- Investment in Dow Jones Industrial Average: 9.72% CAGR
Facts worth noting: Virginia M. Rometty "suspended" share buybacks with the acquisition of Red Hat in 2019. There is still $2 billion authorized by the board of directors that is unspent. The Red Hat acquisition was a $35.1 billion acquisition—approximately $3 million per employee. James (Jim) Whitehurst has exited the company. Arvind Krishna detailed performance information is: [here].
