Lou Gerstner wrote, "People truly do what you inspect, not what you expect." … Lest we forget, these "inspection pages" exist because chief executives are "people" too.
Arvind Krishna: IBM's 2020-23 Employee Revenue and Profit Productivity
|
|
Date Published: April 11, 2022
Date Modified: April 15, 2024 |
Arvind Krishna's 2020-23 Employee Revenue and Profit Productivity
- Evaluating Arvind Krishna's 2020-23 Employee Sales and Profit Productivity
- Arvind Krishna's 2020-23 Employee Sales Productivity by the Numbers
- Arvind Krishna's 2020-23 Employee Profit Productivity by the Numbers
Evaluating Arvind Krishna's 2020-23 Employee Sales and Profit Productivity
What were Arvind Krishna's and IBM's revenue and profit productivity performance numbers for the last four years? Sales productivity per employee for the years 2020, 2021, 2022, and 2023 were down 2.4% and 5% for the first two years and up 4.3% and 4.2% for the last two years, respectively. Profit productivity per employee for the years 2020, 2021, 2022, and 2023 were down 39.4% but up 25.4%, 5.3% and 25%, respectively. Essentially, not considering inflation, both sales and profit productivity have returned in 2023 to where they were four years earlier at the end of 2019 when Virginia (Ginni) M. Rometty turned IBM over to Arvind Krishna.
Over the last four years, IBM's revenue productivity per employee was up 0.8% (.008) and IBM's profit productivity was down .0006% (.000006). Essentially every IBM employee is now producing the same revenue and profit in 2023 as they did in 2019: approximately $200,000 of revenue and $24,573 of profit—even after a significant acquisition (Red Hat), a significant divestiture (Kyndryl), and thirty-nine other acquisitions for an average of ten acquisitions per year [Acquisition activity can be viewed here]. Unfortunately, inflation which was mostly ignored by analysts for the last decade has become an important consideration because over these four years, inflation was up almost 20%: 19.2%.
Over the last four years, IBM's revenue productivity per employee was up 0.8% (.008) and IBM's profit productivity was down .0006% (.000006). Essentially every IBM employee is now producing the same revenue and profit in 2023 as they did in 2019: approximately $200,000 of revenue and $24,573 of profit—even after a significant acquisition (Red Hat), a significant divestiture (Kyndryl), and thirty-nine other acquisitions for an average of ten acquisitions per year [Acquisition activity can be viewed here]. Unfortunately, inflation which was mostly ignored by analysts for the last decade has become an important consideration because over these four years, inflation was up almost 20%: 19.2%.
As the reader will discern from these charts, IBM's employee sales and profit productivities have been dropping for a very long time—more than two decades. Although at first blush it would superficially appear that Arvind Krishna has stopped the downward trend in employee productivity, inflation considerations tell a deeper, more concerning story.
Review these charts and numbers and decide for yourself.
Review these charts and numbers and decide for yourself.
Arvind Krishna's 2020-23 Employee Sales Productivity
- Arvind Krishna: IBM"s 2020-2023 Employee Sales Productivity
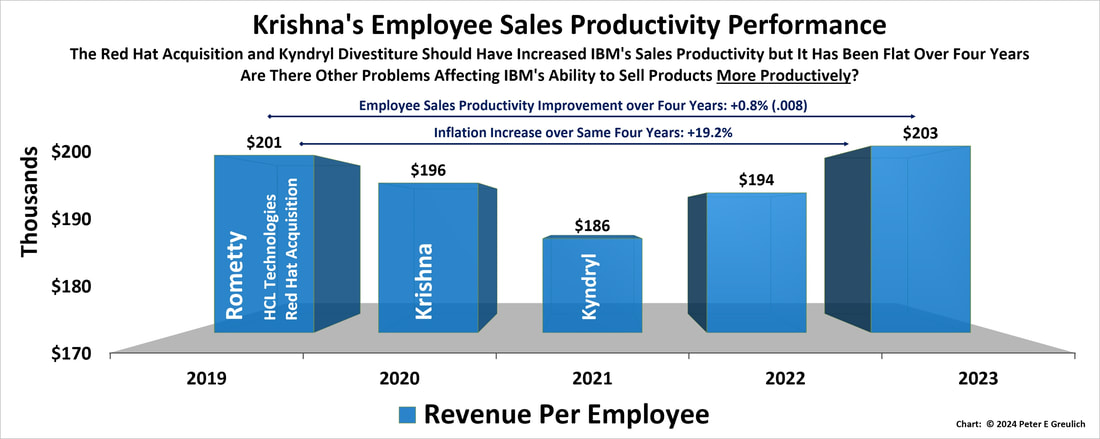
- IBM Employee Revenue or Sales Productivity was up .8% (+.008) since the end of 2019, falling 2.4% in 2020 and 4.9% in 2021 but increasing 4.3% in 2022 and 4.2% in 2023. Every one of IBM's 305,300, 2023 employees is now producing sales at approximately the same level as the corporation's 2019 employees: $201,008 (2019) vs. $202,620 (2023).
This chart depicts the inflation rate over this four year period but does not consider its impact.
Inflation was up almost 20%: 19.2%.*
- IBM Employee Revenue or Sales Productivity was up .8% (+.008) since the end of 2019, falling 2.4% in 2020 and 4.9% in 2021 but increasing 4.3% in 2022 and 4.2% in 2023. Every one of IBM's 305,300, 2023 employees is now producing sales at approximately the same level as the corporation's 2019 employees: $201,008 (2019) vs. $202,620 (2023).
- Krishna & Rometty: IBM's 2011–2023 Employee Sales Productivity
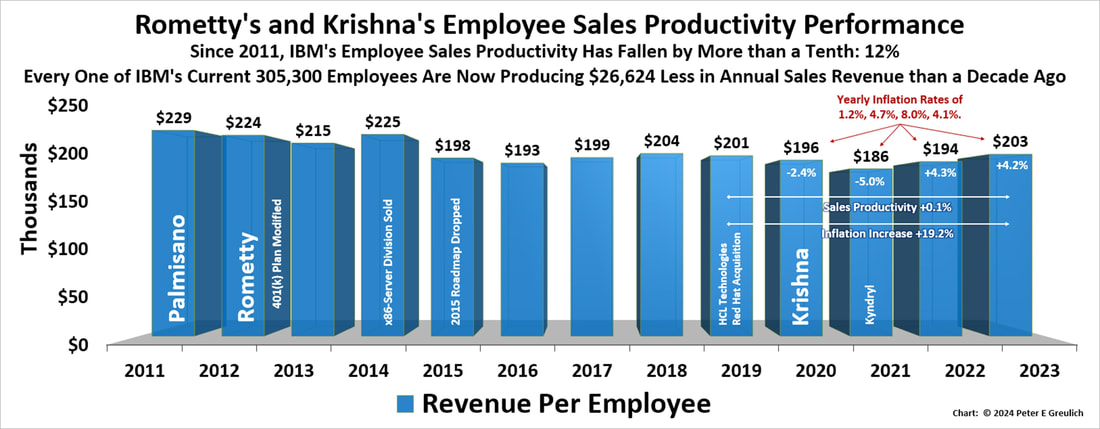
- IBM Employee Revenue or Sales Productivity was down 11.6% since the end of 2011. Every one of IBM's 305,300 employees is now producing $26,624 less revenue than in 2011.
This chart does not consider the impact of inflation over this timeframe.
Inflation was up 35%.*
- IBM Employee Revenue or Sales Productivity was down 11.6% since the end of 2011. Every one of IBM's 305,300 employees is now producing $26,624 less revenue than in 2011.
- Krishna, Rometty, Palmisano & Gerstner: IBM's 1999–2023 Employee Sales Productivity
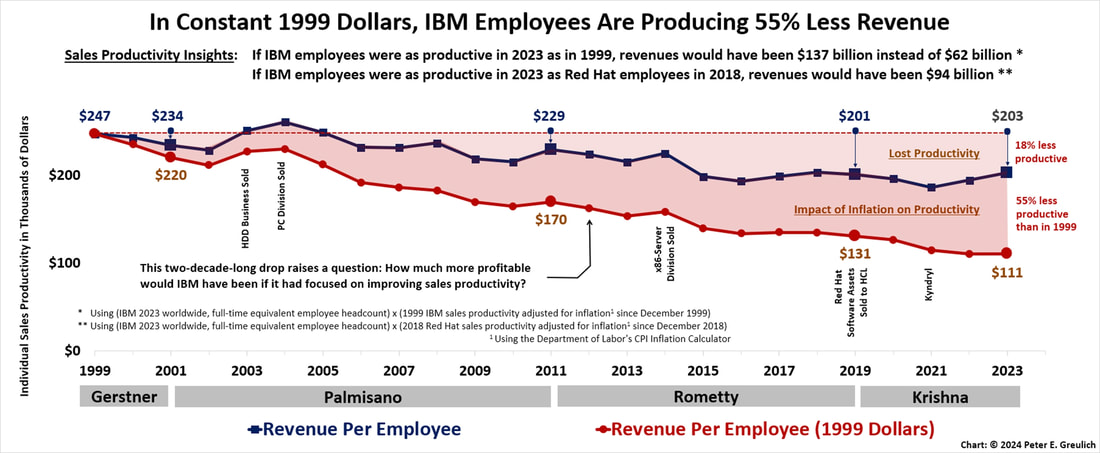
- IBM Employee Revenue or Sales Productivity was down 18% since the end of 1999. Every one of IBM's 305,300 employees is now producing $44,428 less revenue than in 1999—not taking inflation into consideration. See the chart below to quantify the impact of inflation—55.2% less revenue production per employee.
- If a 2023 IBM employee were as productive of revenue as a 1999 IBM employee—considering inflation, 2023 revenues would have been $137 billion, not $62 billion. All stakeholders should be asking why the top executives at IBM are failing in such a critical area as improving employee sales productivity.
- If a 2023 IBM employee were as productive of revenue as a 2018 Red Hat employee—considering inflation, revenues would have been $94 billion, not $62 billion. This should raise many questions about the effectiveness of Arvind Krishna's and IBM's integration of the Red Hat culture, employees, and technology.
This chart depicts the impact of inflation on an IBM employee's sales productivity in the 21st Century.
Arvind Krishna's 2020-23 Employee Profit Productivity
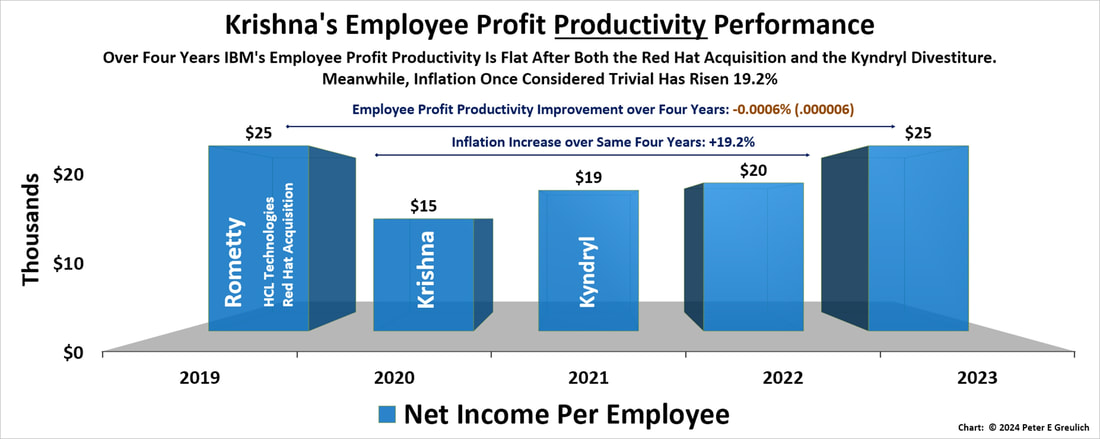
- Arvind Krishna: IBM's 2020-2023 Employee Profit Productivity
- IBM Employee Net Income or Profit Productivity was down .0006% (.000006) since the end of 2019, falling 39.4% in 2020 but recovering over the next three years by increasing 25.3% in 2021, 5.3% in 2022, and 25% in 2023. Essentially, IBM employees in 2023 and IBM employees in 2019 were equally effective in the production of profit: $24,753.
This chart depicts the inflation rate over this four year period but does not consider its impact.
Inflation was up almost 20%: 19.2%.*
- IBM Employee Net Income or Profit Productivity was down .0006% (.000006) since the end of 2019, falling 39.4% in 2020 but recovering over the next three years by increasing 25.3% in 2021, 5.3% in 2022, and 25% in 2023. Essentially, IBM employees in 2023 and IBM employees in 2019 were equally effective in the production of profit: $24,753.
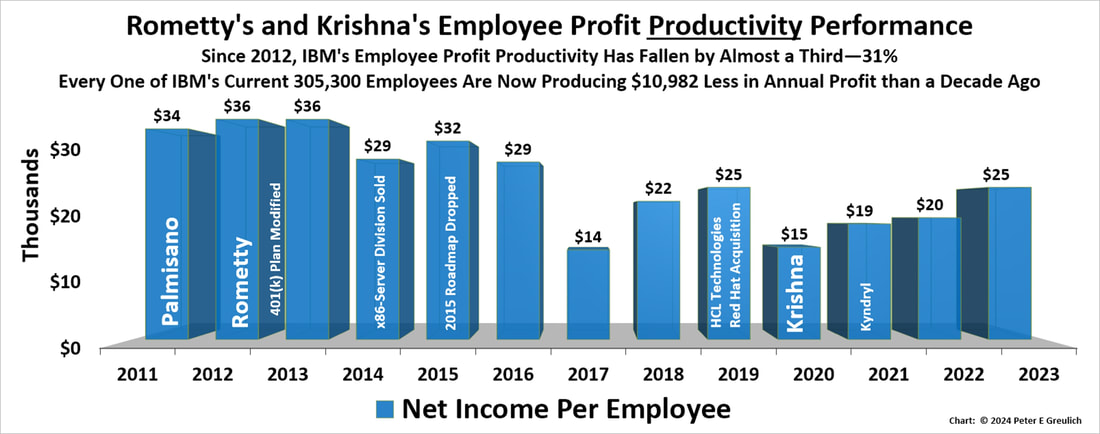
- Krishna & Rometty: IBM's 2011–2023 Employee Profit Productivity
- IBM Employee Net Income or Profit Productivity was down 27.7% since the end of 2011 and fell 30.9% after reaching a profit productivity high in 2012—a drop of almost a third in employee productive. Every one of IBM's 305,300 employees is now producing $10,982 less profit than in 2011-2013. IBM hit a profit productivity brick wall in 2011-2013 after a decade of workload rebalancing—outsourcing employment to lower-wage but less-productive organizations overseas.
This chart does not consider the impact of inflation over this timeframe.
Inflation was up 35%.*
- IBM Employee Net Income or Profit Productivity was down 27.7% since the end of 2011 and fell 30.9% after reaching a profit productivity high in 2012—a drop of almost a third in employee productive. Every one of IBM's 305,300 employees is now producing $10,982 less profit than in 2011-2013. IBM hit a profit productivity brick wall in 2011-2013 after a decade of workload rebalancing—outsourcing employment to lower-wage but less-productive organizations overseas.
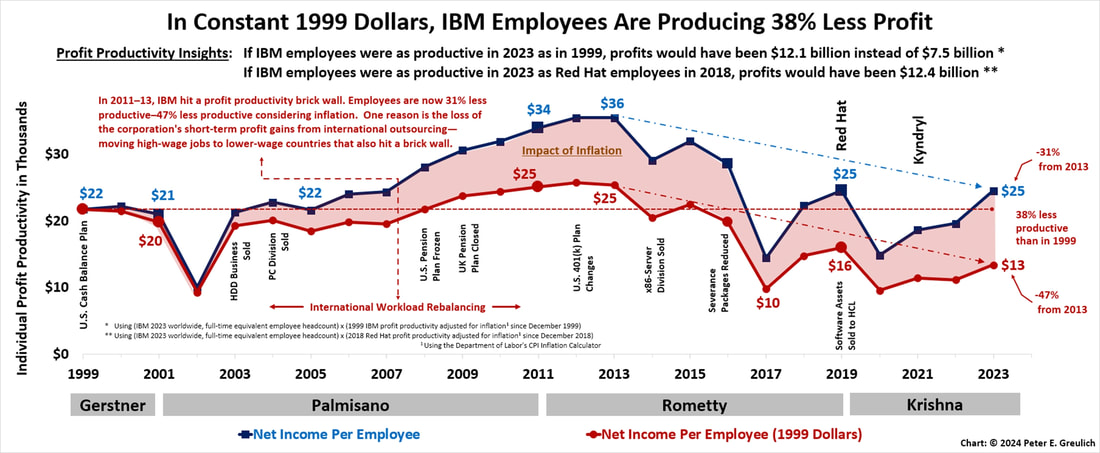
- Krishna, Rometty, Palmisano, & Gerstner: IBM's1999-2023 Employee Profit Productivity
- IBM's 2011-2013 Employee Net Income or Profit Productivity brick wall is best visualized in this chart. Since 2011-2013, employee profit productivity is down 31% and when considering inflation down 47%.
Since 1999, IBM profit productivity appears to have risen 12.9%—by $2,811 per employee, but when inflation is taken into account, it has actually fallen by 38.2%—$8,327 less profit per employee.
This chart depicts the impact of inflation on an IBM employee's profit productivity in the 21st Century.
- IBM's 2011-2013 Employee Net Income or Profit Productivity brick wall is best visualized in this chart. Since 2011-2013, employee profit productivity is down 31% and when considering inflation down 47%.
* Inflation numbers are from the Federal Reserve Bank of Minneapolis.