Lou Gerstner wrote, "People truly do what you inspect, not what you expect." … Lest we forget, these "inspection pages" exist because chief executives are "people" too.
Arvind Krishna's First-Year Revenue and Profit Growth Performance
- The Importance of Revenue and Profit Growth
- Arvind Krishna's First-Year Revenue Growth by the Numbers
- Arvind Krishan's First-Year Profit Growth by the Numbers
Evaluating Arvind Krishna's First-Year Revenue and Profit Growth
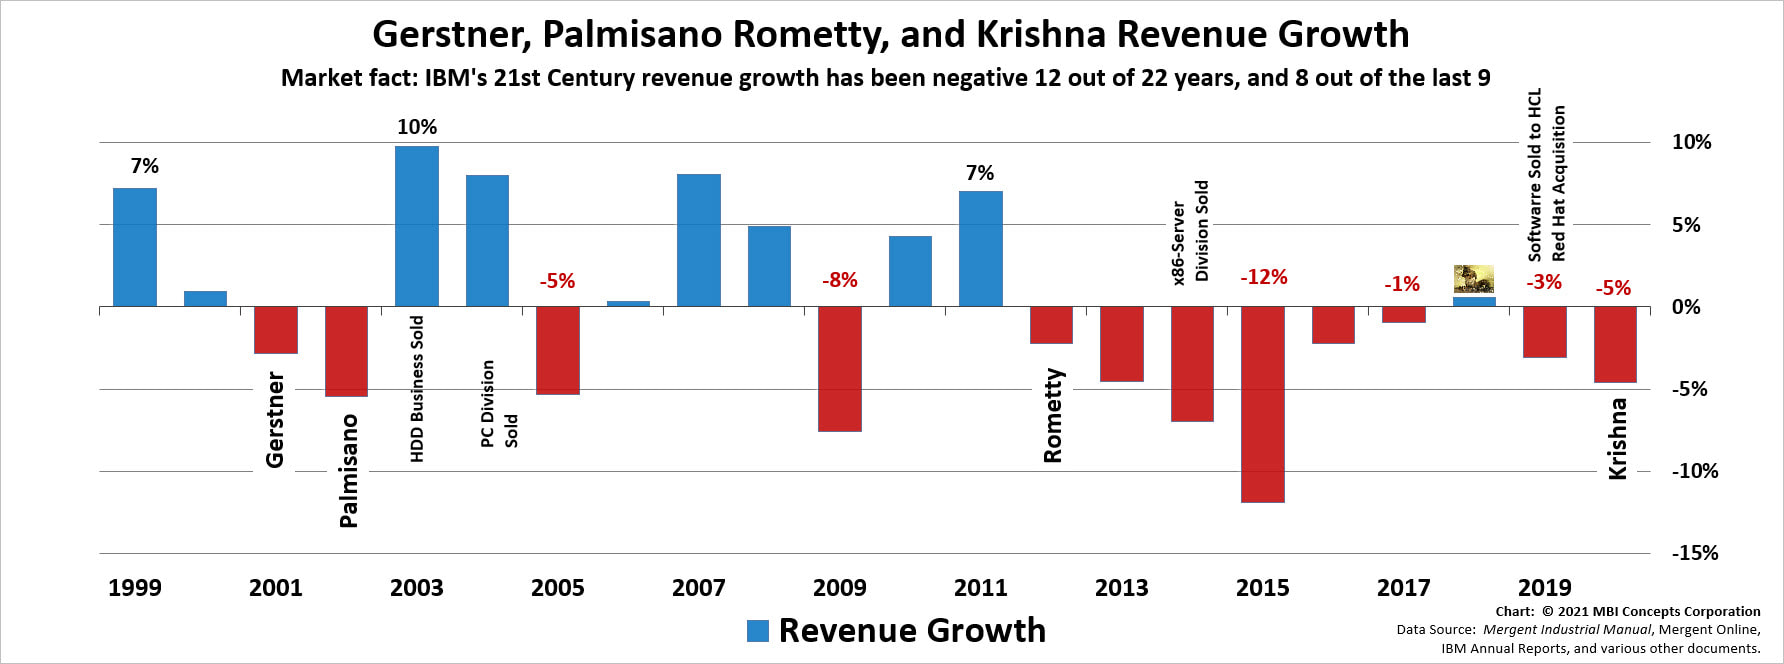
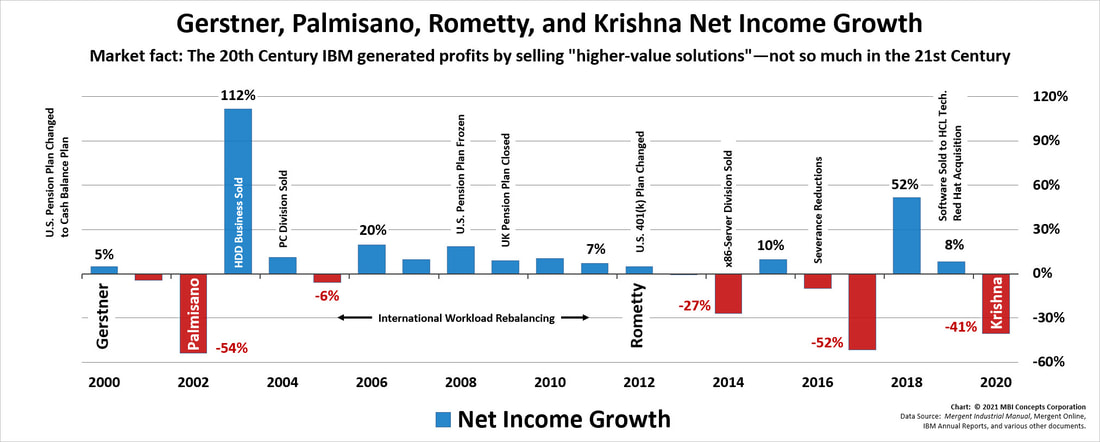
What were Arvind Krishna's first-year 2020 revenue and profit growth performance numbers? For the full year of 2020, revenue growth was down 5% and profit growth was down 41%.
Although the previous revenue and profitability charts documented these chief executive officers’ critical metrics, the following charts analyze their respective year-to-year growth rates. They present a case that a corporation can pad profitability numbers through financial engineering, but that sales performance is much harder to game.
These charts show revenue growth is a serious problem, and that profit growth has been propped up with some serious financial engineering—following short-term, financially expedient paths at the expense of the long-term health of the business. These charts challenge the perspective that IBM has been divesting and investing to move into higher-value markets with higher profit margins.
The net income growth chart documents a few of the financial engineering “projects” the corner office has implemented through their financial and human resource divisions: workforce rebalancing, resource actions, divestiture of critical assets, and employee benefit reductions.
As can be seen in the profit growth charts below, some of these activities—like the divestiture of the x86 Server Division—had an almost immediate negative consequence which has never been highlighted in the press. Other activities are the cause of the long-term downward trend in employee revenue and profit productivity that is covered in the next key performance metric, which also seems to need more discussion within the press and research within the analyst communities.
Arvind Krishna's First-Year Revenue Growth by the Numbers
- Krishna 2020 Revenue Growth: Down 5%
- Krishna & Rometty 2012–20 Revenue Growth: Positive Only One Time—Barely
- Krishna, Rometty, Palmisano & Gerstner 2000–20 Revenue Growth: Over Two Decades, Revenue Growth Was “Substantial” Only Six Times
Arvind Krishna's First-Year Profit Growth by the Numbers
- Krishna 2020 Profit Growth: Down 41%
- Krishna & Rometty 2012–20 Profit Growth: A Seesaw with Four Years Up and Five Years Down
- Krishna, Rometty, Palmisano & Gerstner 2000–20 Profit Growth: Financial Engineering Kept Growth Mostly—but Barely—Positive, at the Cost of Employee Engagement, Passion and Enthusiasm


