Lou Gerstner wrote, "People truly do what you inspect, not what you expect." … Lest we forget, these "inspection pages" exist because chief executives are "people" too.
Arvind Krishna: 2020-23 Revenue and Profit Growth
|
|
Date Published: April 11, 2022
Date Modified: April 15, 2024 |
Arvind Krishna's 2020-23 Revenue and Profit Growth Performance
- The Importance of Revenue and Profit Growth
- Arvind Krishna's 2020-23 Revenue Growth by the Numbers
- Arvind Krishan's 2020-23 Profit Growth by the Numbers
Evaluating Arvind Krishna's 2020-23 Revenue and Profit Growth
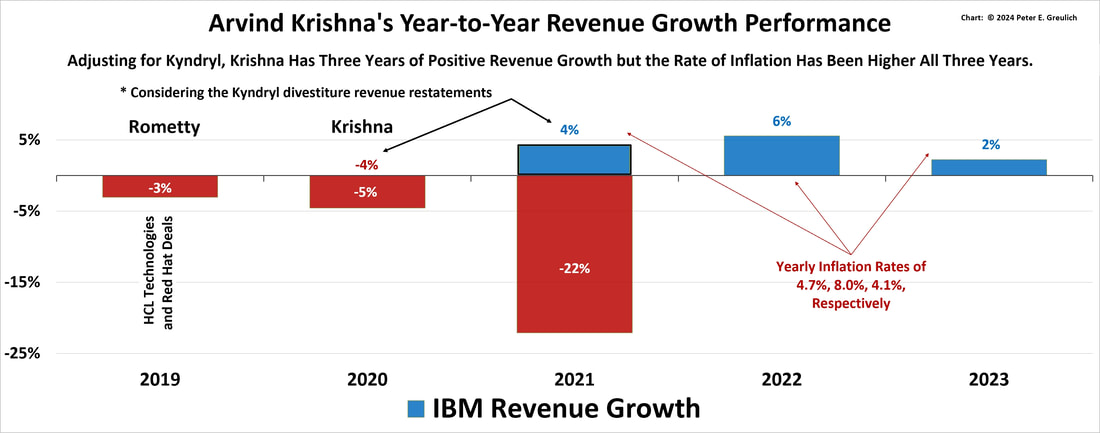
What were Arvind Krishna's fourth-year 2020-23 revenue and profit growth performance numbers? IBM’s 2023 Revenue Growth under Arvind Krishna’s leadership was up 2.2% in 2023. In the previous three years, IBM’s revenue growth was down -4.6% in 2020 (down -4.4% considering the Kyndryl divestiture); down 22.1% in 2021 (up 3.9% considering the Kyndryl divestiture); and up 5.5% in 2022.
|
Unfortunately, inflation has been higher than the corporation’s revenue growth in all four years of Arvind Krishna’s leadership of IBM: IBM’s 2020 revenue growth was down 4.4% and inflation was up 1.2%; IBM’s 2021 revenue growth was up 3.9% but inflation was up more at 4.7%; IBM’s 2022 revenue growth was up 5.5% but inflation was up more at 8.0%; and finally, IBM’s 2023 revenue growth was up 2.2% but inflation was up more at 4.1%.
Although the previous revenue and profitability charts documented Arvind Krishna's two critical revenue and profitability metrics, the following charts analyze their respective year-over-year growth rates. They present a case that a corporation can pad short-term profitability numbers through financial engineering or aggressive bookkeeping, but that sales performance is much harder to game. These charts show revenue growth is a serious problem, and that profit growth has been propped up with some serious financial engineering—following short-term, financially expedient paths at the expense of the long-term health of the business.
|

Inflation is a concern
|
These charts challenge the perspective that IBM has been divesting and investing to move into higher-value, more-profitable markets, because if it was, IBM's customers would be buying into the corporation's newest solutions as the products return ever-higher value to their businesses.
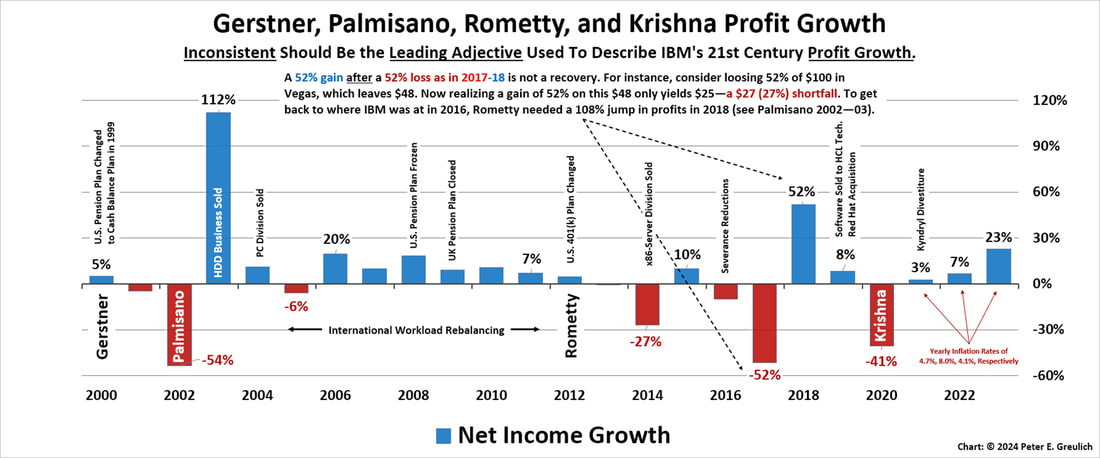
The 1999-2023 profit growth chart below documents a few of the financial engineering “projects” the corner office implemented through their financial and human resource divisions: workforce rebalancing, resource actions, divestiture of critical assets, and employee benefit reductions. This is critical to highlight because these are unsustainable processes that can spike short-term profits but can also drive long-term negative consequences for any corporation.
As can be seen in the profit growth charts below, some of these activities—like the divestiture of the x86 Server Division—had an almost immediate negative growth consequence which has never been highlighted in the press. Many of these highlighted activities to prop up short-term profits are causing a long-term downward trend in employee revenue and profit productivity that is covered in the next key performance productivity metric, which also seems to need more discussion within the press and more in-depth, long-term research by the analyst communities.
Arvind Krishna's 2020-23 Revenue Growth by the Numbers
- Krishna 2020-23 Revenue Growth
- IBM’s 2023 Revenue Growth under Arvind Krishna’s leadership was up 2.2% in 2023. In the previous three years, IBM’s revenue growth was down -4.6% in 2020 (down -4.4% considering the Kyndryl divestiture); down 22.1% in 2021 (up 3.9% considering the Kyndryl divestiture); and up 5.5% in 2022.
Unfortunately, inflation has been higher than the corporation’s revenue growth in all four years of Arvind Krishna’s leadership of IBM. Using the Kyndryl divestiture revenue growth percentages as the best case scenario, IBM’s 2023 Revenue Growth rates as compared with inflation were as follows: IBM’s 2020 revenue growth was down 4.4% and inflation was up 1.2%; IBM’s 2021 revenue growth was up 3.9% but inflation was up more at 4.7%; IBM’s 2022 revenue growth was up 5.5% but inflation was up more at 8.0%; and finally, IBM’s 2023 revenue growth was up 2.2% but inflation was up more at 4.1%.
- IBM’s 2023 Revenue Growth under Arvind Krishna’s leadership was up 2.2% in 2023. In the previous three years, IBM’s revenue growth was down -4.6% in 2020 (down -4.4% considering the Kyndryl divestiture); down 22.1% in 2021 (up 3.9% considering the Kyndryl divestiture); and up 5.5% in 2022.
- Krishna & Rometty 2011–23 Revenue Growth
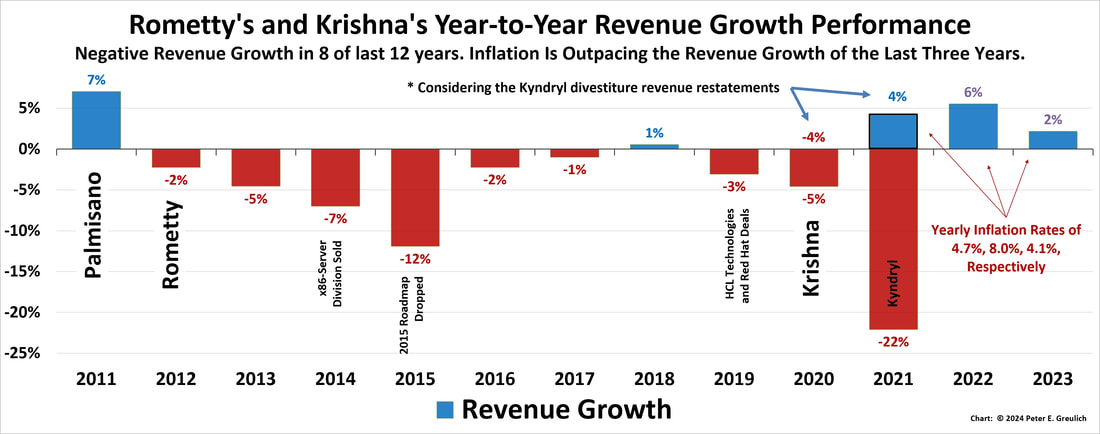
- IBM Revenue Growth in this decade-long, revenue-growth, bar chart is not a pretty picture. IBM's annual revenue growth was only positive four out of twelve years—taking Kyndryl out of the picture, three out of twelve years, and in each of the last three years (2021-23) inflation outperformed IBM's revenue growth.
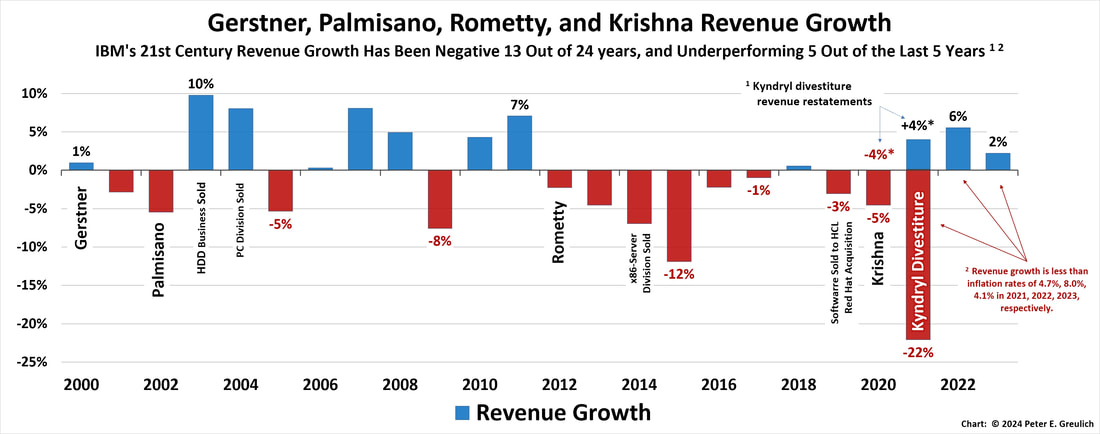
- Krishna, Rometty, Palmisano & Gerstner 1999–2023 Revenue Growth
- IBM Revenue Growth in this twenty-first-century chart is a picture of inconsistency. Annual revenue growth was negative thirteen out of the last twenty-four years. In each of the last three years (2021-23) inflation outperformed IBM's best-case revenue growth. So, considering inflation, it is easy to add a footnote to this chart that states: "Considering inflation IBM has had negative revenue growth in fifteen out of the last twenty-four years."
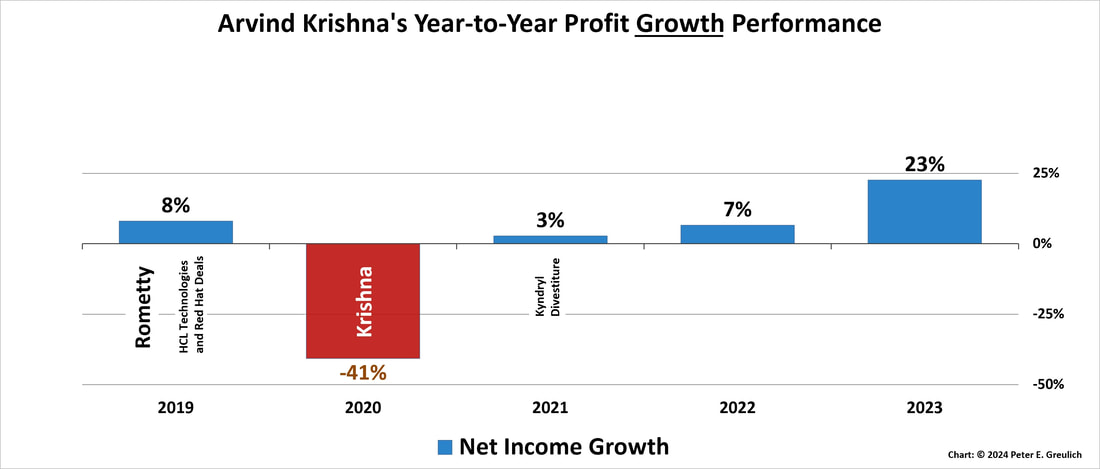
Arvind Krishna's 2020-23 Profit Growth by the Numbers
- Krishna 2020-23 Profit Growth
- IBM’s 2023 Profit Growth under Arvind Krishna’s leadership was up 22.6% in 2023. In the three previous years, IBM’s profit growth was down -40.7% in 2020, up 2.7% in 2021, and up 6.6% in 2022. Considering inflation over these four years, IBM’s profits were down 20% while inflation was up almost 20%—19.2%.
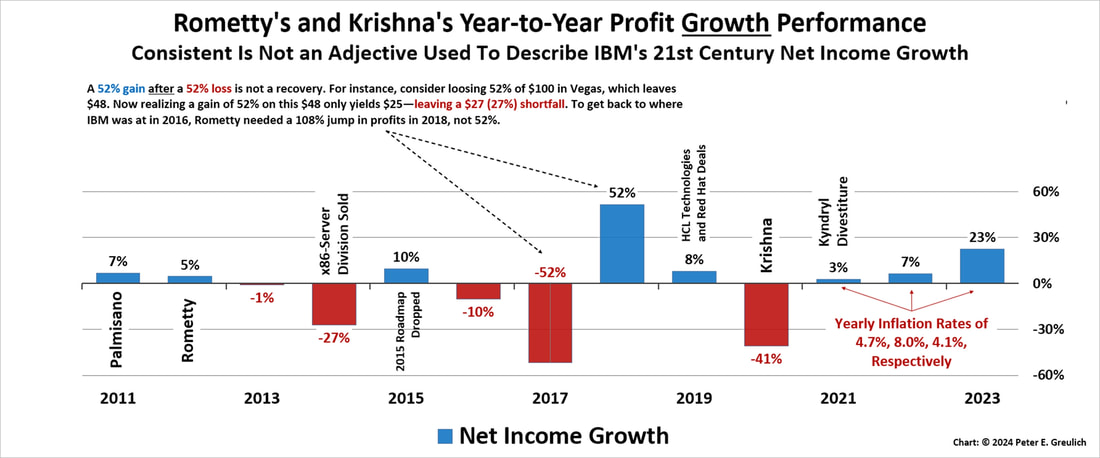
- Krishna & Rometty 2011–23 Profit Growth
- IBM Net Income or Profit Growth was down five years and up seven years—considering inflation down seven years and up five years. This seesaw picture of inconsistent profit growth combined with the lack-of-growth revenue chart above should cause any analyst to question the corner offices' on-going premise that they are focusing on building products of higher value that are in demand by their customers.
- Krishna, Rometty, Palmisano & Gerstner 1999–2023 Profit Growth
- IBM Net Income or Profit Growth was supported in the first decade of the twenty-first century by financial engineering and aggressive bookkeeping as annotated on this chart. These tactics appear to have reached their limits in 2011-2012.