If my foresight were as clear as my hindsight, I should be better off by a damned sight.
If my foresight were as clear as my hindsight, I should be better off by a damned sight.
Evaluating Different Measurements of Worldwide Patent Leadership
- Introduction
- A Simple Baseball Analogy Applied to Patent Leadership
- Top Five 2019 Patent Rankings
- Top Five 2019 Ultimate Patent Owners
- Overview of Patent Leadership Information
- Author's Thoughts
Introduction
|
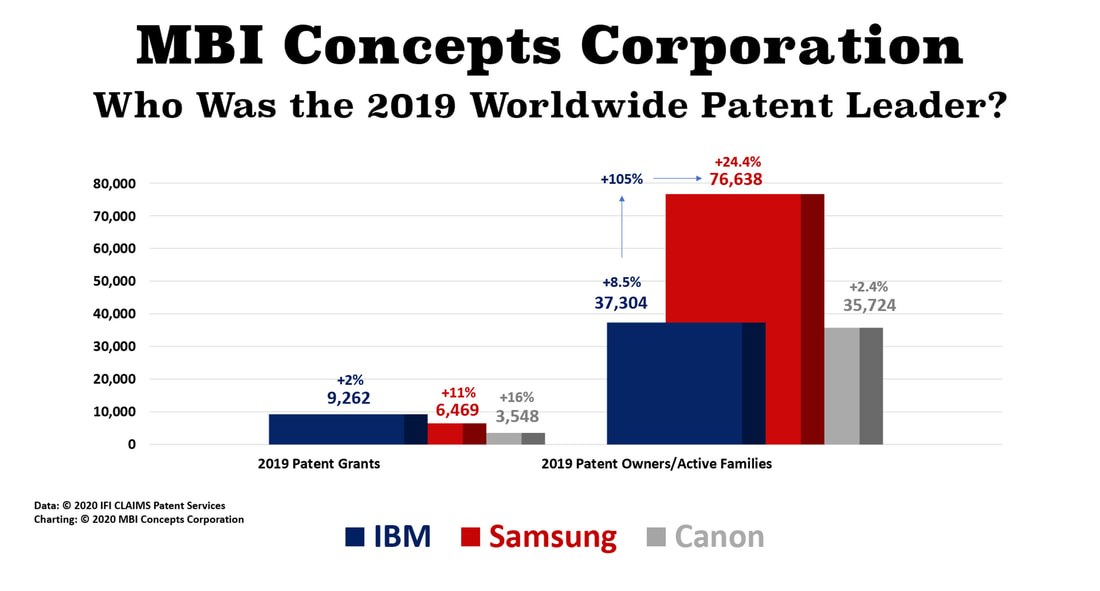
By a new patent measurement, Samsung was the 2019 patent leader and leads IBM by no small margin: a whopping 105%. The real dilemma that needs to be addressed is if the technology industry and the press that follows it, will actually be responsive to not just “big data” but “new data” when it surfaces and challenges old, traditional ways of thinking?
|
Select image to read article dated January 21, 2020
|
The problem is getting the market to accept a more realistic measurement of “patent leadership.” If the technology industry can be so persuaded, this author will need to add a few more “p's” to his oft-written statement about IBM's 21st Century leadership:
The way to measure patent leadership in 2018 entered a brave new world. It evolved from a short-term, point-in-time measurement to a long-term, accountability measurement. In the area of patents, it appears the industry is taking a step towards changing its methodology to determine who is truly winning the patent game—who keeps putting the most points on the scoreboard.
Let’s use a simple baseball analogy to get the point across.
- "For the last two decades Gerstner, Palmisano and Rometty have invested $200 billion in paper instead of investing in making their people more productive, their processes more effective, their products more valuable and their patent portfolio more potent."
The way to measure patent leadership in 2018 entered a brave new world. It evolved from a short-term, point-in-time measurement to a long-term, accountability measurement. In the area of patents, it appears the industry is taking a step towards changing its methodology to determine who is truly winning the patent game—who keeps putting the most points on the scoreboard.
Let’s use a simple baseball analogy to get the point across.
A Baseball Analogy Applied to Patent Leadership
There is probably no better sport than baseball as an example of this new way of tracking patent leadership. In baseball, minutiae are tracked to the nth degree. At almost any time a baseball aficionado can pull up statistics to track a team’s performance. Of course, even after analyzing all these minute details, what really matters is who puts the most runners across home plate.
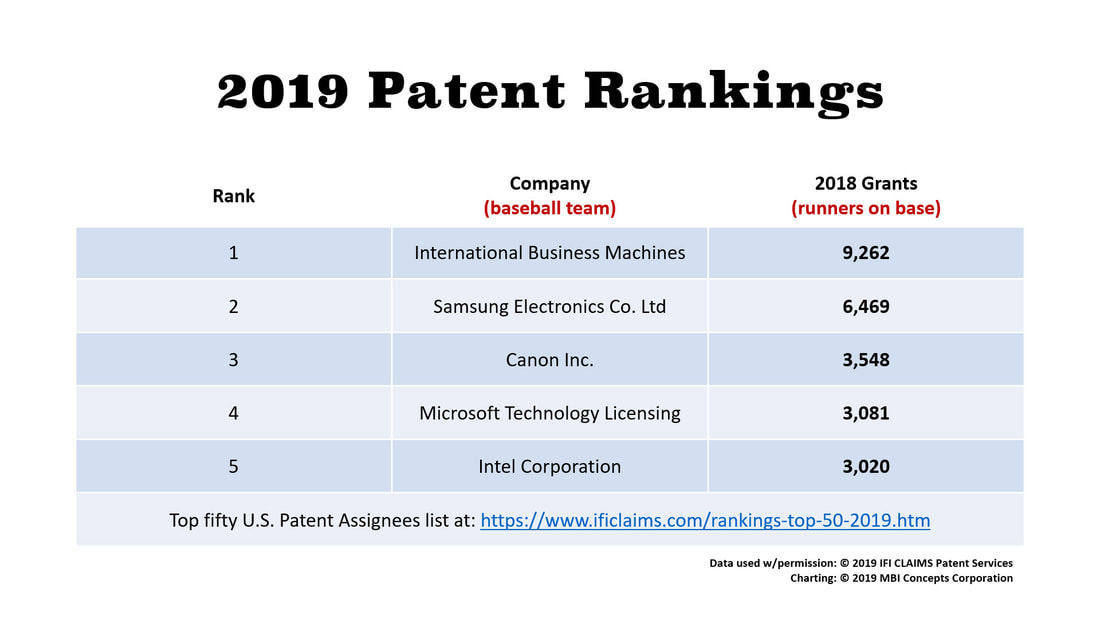
In patents, the current way of tracking patent leaders is to count the number of patents granted in a particular year, chart the number of patents granted, and declare a winner. This is analogous in the game of baseball to tracking the number of runners who “get on base.”
The chart below shows IBM once again leading in putting “runners on base” or patents granted in 2019.
Although, this is a great way to position yourself to win a baseball game, you still have to execute to advance the runners, because if you don’t, you will also lead in another critical statistic: runners "left on base." What truly matters in winning a baseball game is putting the most runners “across home plate.” A competitor can win a game even if they put fewer runners on base by leaving a smaller percentage of their runners stranded on base—which is a long way of saying, “They outscore their competition.”
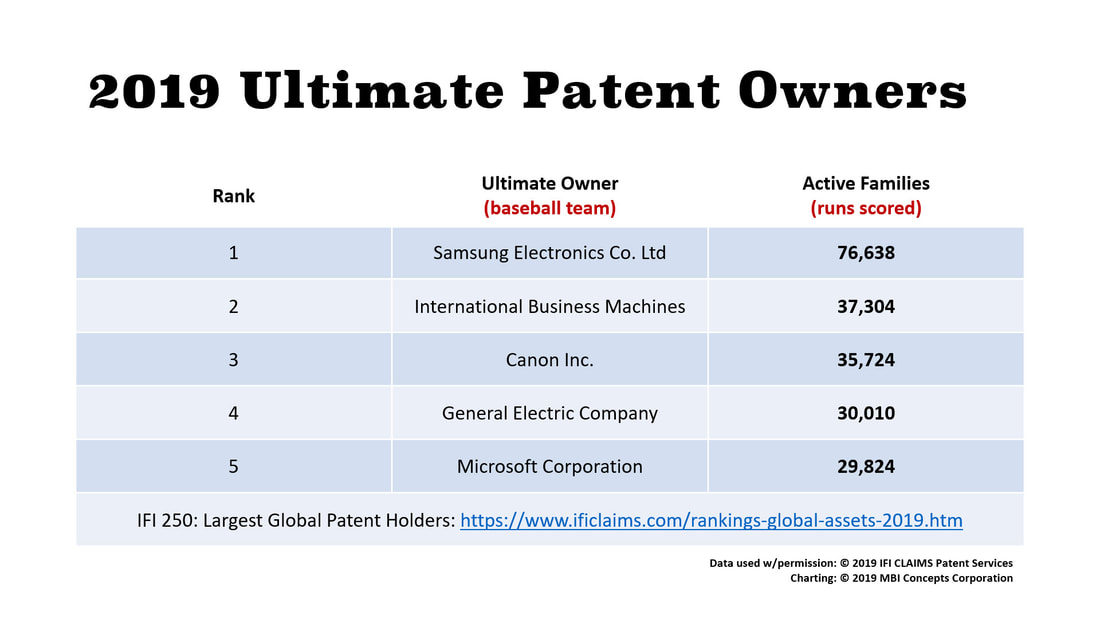
The chart below shows the number of runners “crossing home plate” or active families which are adding value to their respective corporations. [See Footnote #1]
The chart below shows the number of runners “crossing home plate” or active families which are adding value to their respective corporations. [See Footnote #1]
Samsung, in patents, is the equivalent of a winning baseball team that is putting fewer runners on base (43% less patents granted in a single year than IBM) but must have processes in place to keep advancing its runners (its patents) until they cross home base (105% more patent families than IBM).
In this respect, Samsung can already (and should) tell its employees that in 2020 it is now a “string of two” in a goal to keep outdistancing the rest of the industry in patent leadership.
In this respect, Samsung can already (and should) tell its employees that in 2020 it is now a “string of two” in a goal to keep outdistancing the rest of the industry in patent leadership.
Overview of Patent Leadership Information
When the patent list was published this year, the data for the top contenders comes from a company called IFI CLAIMS Patent Services. It is the data source referenced by all the major articles that published IBM’s leadership for its 27th consecutive year [IBM press release here]. Yet, few mentioned the new fine print.
No one can take away this string of successes that IBM has built year-over-year for a quarter of a century, but the rules of the patent leadership game has just changed. In this case the change makes the patent information long-term and more relevant and is, therefore, better.
No one can take away this string of successes that IBM has built year-over-year for a quarter of a century, but the rules of the patent leadership game has just changed. In this case the change makes the patent information long-term and more relevant and is, therefore, better.
The Author's Thoughts and Perceptions
|
It would be fascinating to see how long IBM has not led in active patent families. It would also be informative to see patent productivity numbers over the past few decades, such as (1) patent grants and active patent families per employee, (2) patent grants and active patent families per research dollar, and finally (3) the number of patents left "stranded on base" over time—ones of so little value the corporation sold them off or did not invest maintenance dollars to keep them active.
Accurate long-term corporate history would be greatly served by this information. Historians could better evaluate the long-term effects of the leadership of Louis V. Gerstner, Samuel J. Palmisano, Virginia M. Rometty who have prioritized investing in paper over people, process, products and, apparently, patents. This may be another leadership position that IBM has—if not already lost according to this new measurement—put at risk. Unfortunately, it does the corporation no favors if the press looks the other way, analysts pull their punches, or if higher-level executives become apologists for the corporation's 21st Century chief executives. |
[Footnote #1] This new analysis calculates the world's largest active patent holders, including subsidiaries, as a snapshot in time as of December 31, 2019. The IFI CLAIMS Ultimate Owner ranking is a completely different view of patent holdings [emphasis added]. Rather than looking at the grants received in a given year, as the Top 50 ranking does, the "Ultimate Owner Ranking" looks at the current cumulative patent holdings. The Ultimate Owner report ranks parent companies by the active patent families they own. The holdings of subsidiary companies are included in the parent company's holdings. See explanation of how patent families compensates for market changes: [here].


