Revenue Growth by IBM CEO
IBM Chief Executive Officers' Year-over-Year Revenue Growth
Revenue growth is a common metric to determine the success or failure of a Chief Executive Officer. Of course, a percentage growth or drop in revenue on a small base appears more significant than a large base. But growth in the early years also brings with it a set of issues, such as finding new customers, that a well established institution may not encounter. So it requires more than just these charts to decide on IBM's best leadership. It is a good starting point, though.
This is just one more piece in assembling a complex puzzle of IBM's corner office leadership.
This is just one more piece in assembling a complex puzzle of IBM's corner office leadership.
Summary of CEO Year-over-Year Revenue Growth
|
|
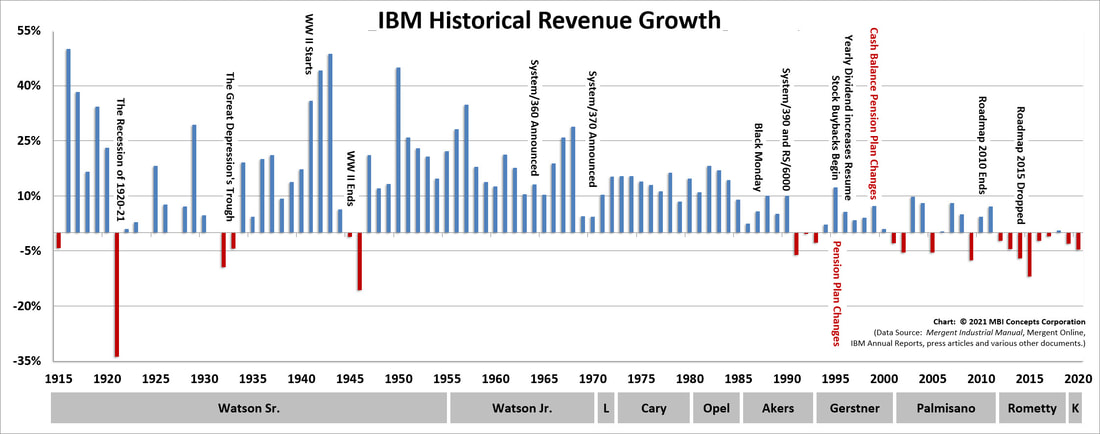
At a Glance: Examining a Century of Year-over-Year Revenue Growth
- Revenue Growth Observations: This chart makes it quite obvious how IBM earned its 20th Century brand, and why the corporation's 21st Century brand is suffering. It is performance that matters, not words.
Facts worth noting: Significant historical events are annotated on these charts. Adding economic and political events help answer questions like, "Why did revenue grow or drop so fast during this period?" A second set of charts focused on the equivalent one-hundred year history of IBM's profit (net income) growth is available [here].
By reviewing these two charts in tandem a researcher is able to see the focus of each individual chief executive and the impact of significant events on the corporation. For instance, by focusing on World War II a researcher can determine that while the corporation's revenue's skyrocketed (from 1940 to 1944 by over 200%), Tom Watson Sr. kept profits suppressed (over the same timeframe to less than a 3% increase). He kept the corporation (and himself) from profiting on the production of wartime munitions.
By reviewing these two charts in tandem a researcher is able to see the focus of each individual chief executive and the impact of significant events on the corporation. For instance, by focusing on World War II a researcher can determine that while the corporation's revenue's skyrocketed (from 1940 to 1944 by over 200%), Tom Watson Sr. kept profits suppressed (over the same timeframe to less than a 3% increase). He kept the corporation (and himself) from profiting on the production of wartime munitions.
|
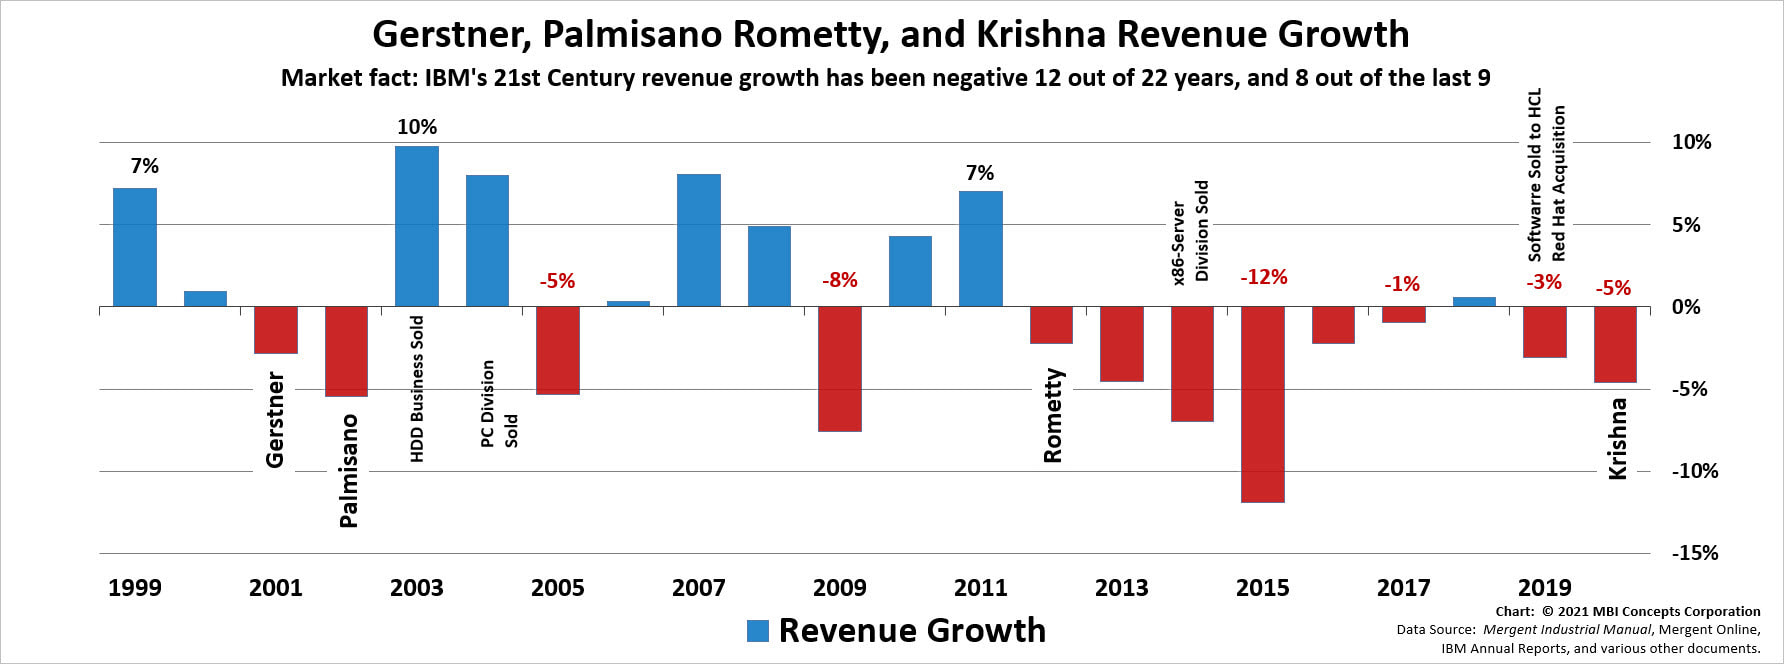
At a Glance: Examining Two Decades of Year-over-Year Revenue Growth: 1999 – 2020 |
- Revenue Growth Observation: IBM in the first decade of the twenty-first century was at best erratic in its revenue performance. In the second decade it was a negative consistency with revenues falling in 8 out of the last 10 years. One wonders why any non-speculative analyst gets excited over a positive year-over-year quarterly revenue increase.
The IBM executive team has a lot to prove and a terrible legacy to overcome.
|
Thomas J. (Tom) Watson Sr.: May 1914 – May 1956 |
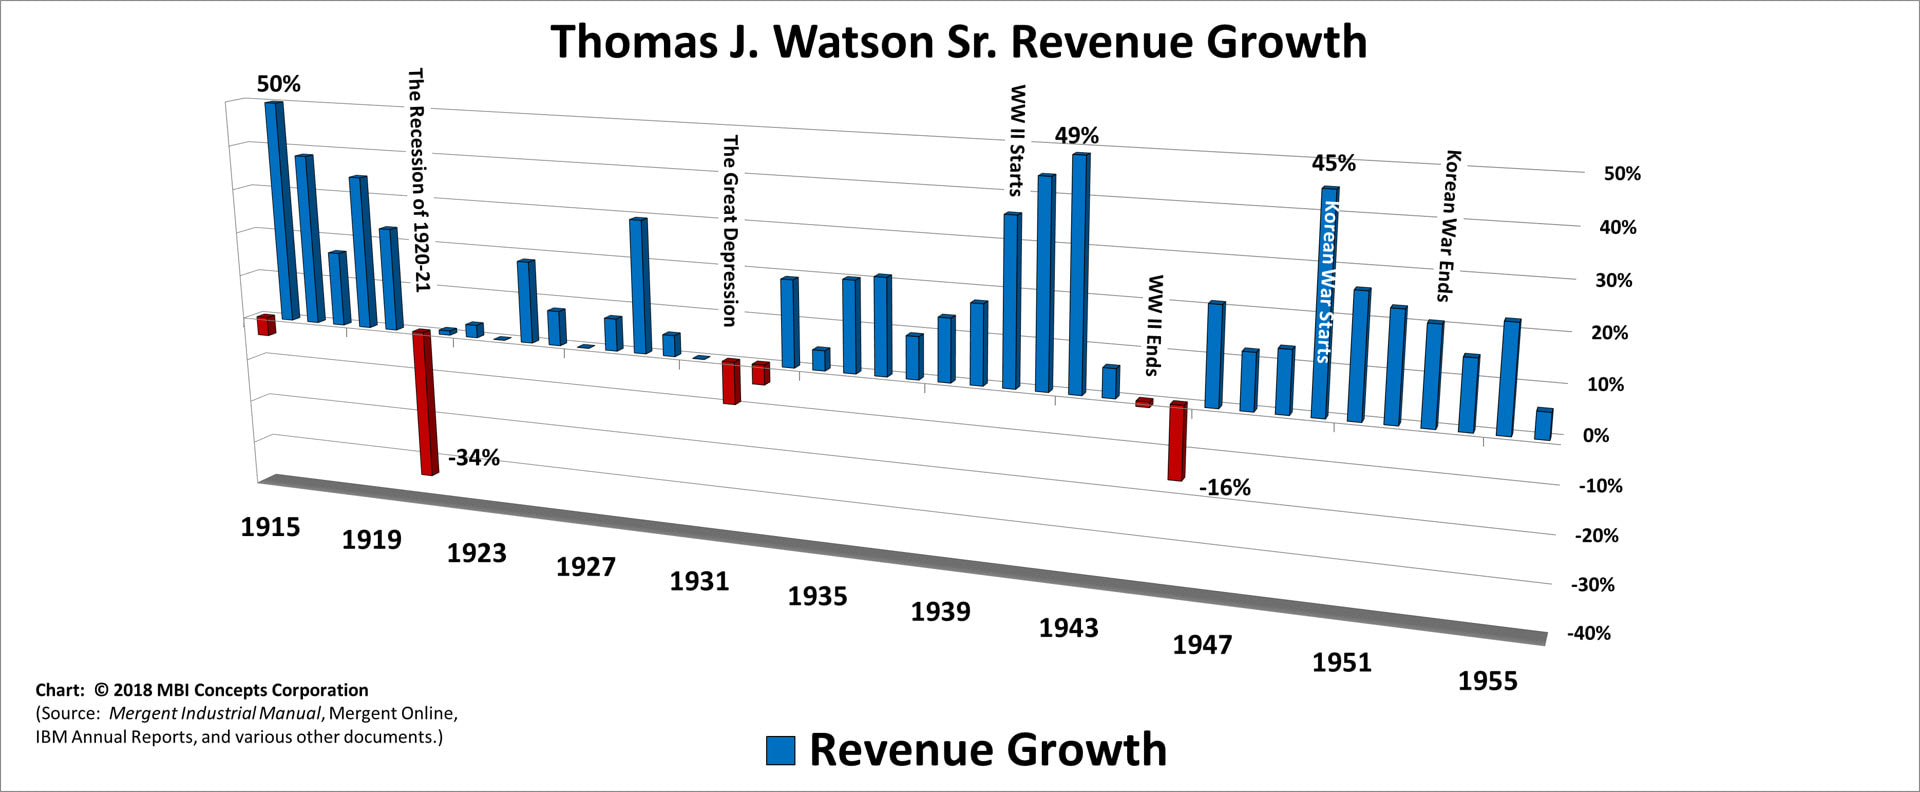
- Largest Revenue Growth Increases: 50%, 49%, and 45%
- Largest Revenue Growth Decreases: 34% and 16%
Facts worth noting: Some authors have taken Watson Sr. to task for the revenue growth reflected above during World War II. Here is an excerpt from a speech Watson Sr. delivered at a dinner in his honor sponsored by the IBM Offices in the Green Bay, Madison and Milwaukee, Wisconsin areas on December 3, 1948. These authors should really do their research more carefully before passing judgement on the leadership of this one inhabitant of IBM's corner office.
"When we went into the war program the government said, "We will furnish the money; you build the buildings." The government furnished the money to build the last new building at Endicott and the first building at Poughkeepsie. Then we decided, my associates and the Board of Directors, that we wanted to give the government everything we had to help the war effort because there were just under 6,000 of our men and women in the service. I said, "Let us do our own financing; we have credit." So, we paid the government all the money it had put in, did our own financing, established a formula on profits so we would not take more than 1 1/2 per cent profit from the government on all of our munitions work."
It turns out that Watson Sr. kept the percentage to less than 1 percent, and the picture is completed with a review of his net income growth during this same war-time period: flat profits as promised. Innuendo that defames a good man and the people of a great company who were committed to winning the war just doesn't stand up to the cold hard facts.
Then again, as Dale Carnegie wrote: A man convinced against his will is of the same opinion still.
|
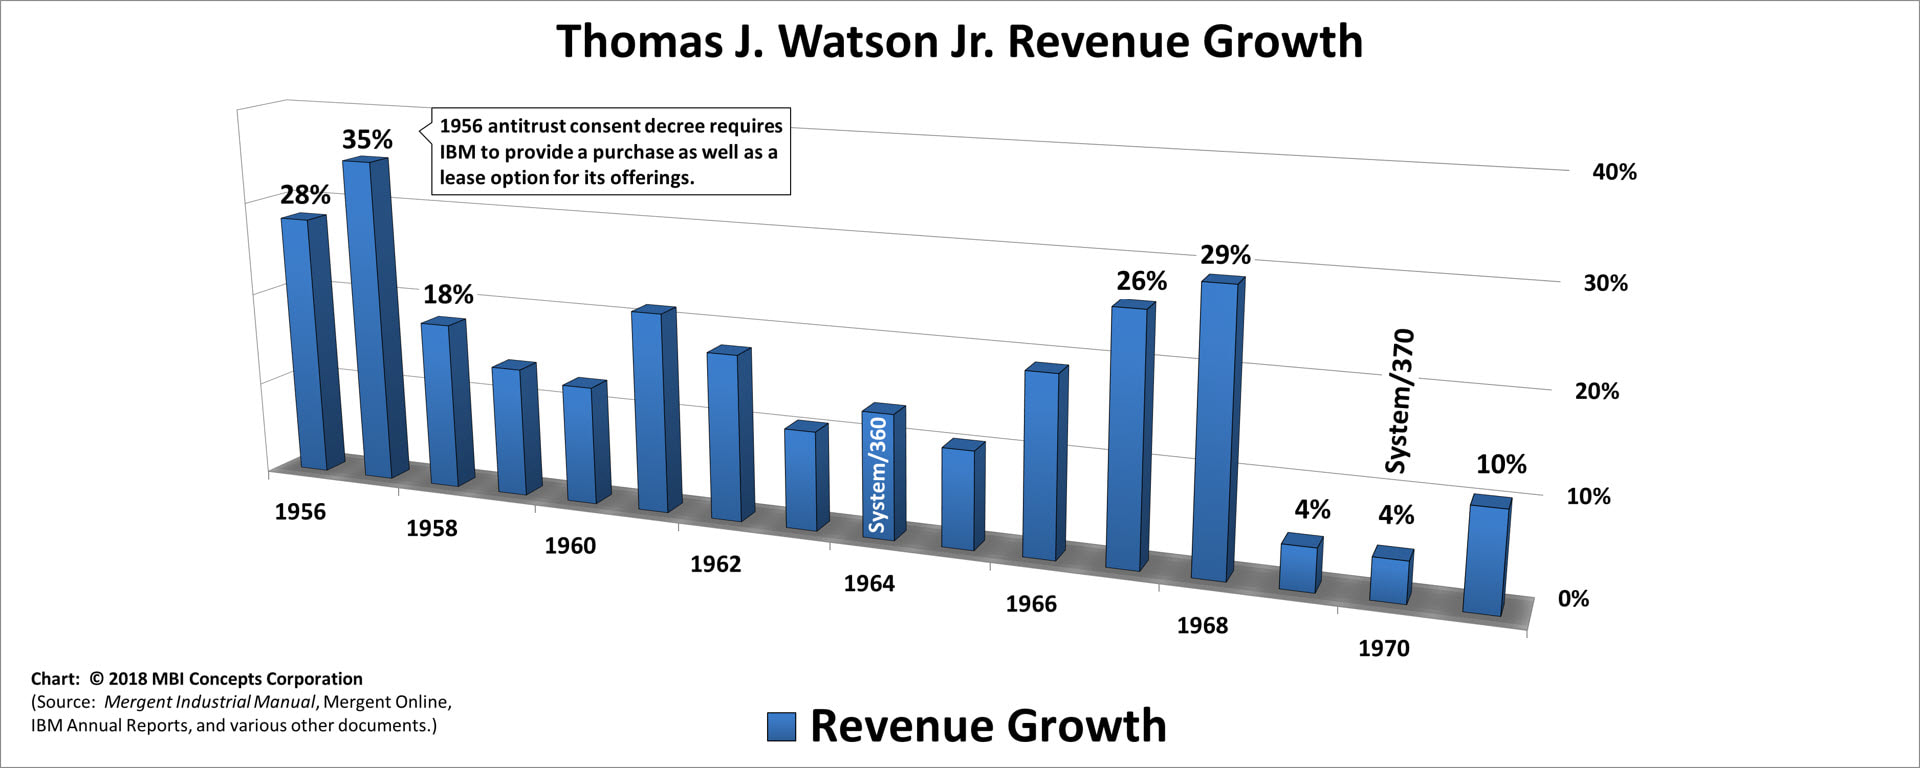
Thomas J. (Tom) Watson Jr.: Jun 1956 – May 1971 |
- Largest Revenue Growth Increases: 35%, 29%, and 28%
- Largest Revenue Growth Decreases: not applicable
Facts worth noting: In 1956, Tom Watson Jr. inherited a company that was famous for high pay, generous benefits, and an intense devotion “to Dad.” Internationally, corporate employment stood at 56,000, revenue at $700 million, and net income at $73 million. Rather than taking another four decades to match those numbers, Watson Jr. added, on average an additional, 56,000 employees every four years, $700 million in revenue every year and a half, and $73 million in net income almost every year.
By 1971, revenue per employee had grown by 150%, net income per employee by more than 200%, and the number of stockholders by more than 2,000%.
Under Watson Jr.’s watch, IBM became the corporation his father had always envisioned.
By 1971, revenue per employee had grown by 150%, net income per employee by more than 200%, and the number of stockholders by more than 2,000%.
Under Watson Jr.’s watch, IBM became the corporation his father had always envisioned.
Peter E. Greulich, THINK Again!: The Rometty Edition
|
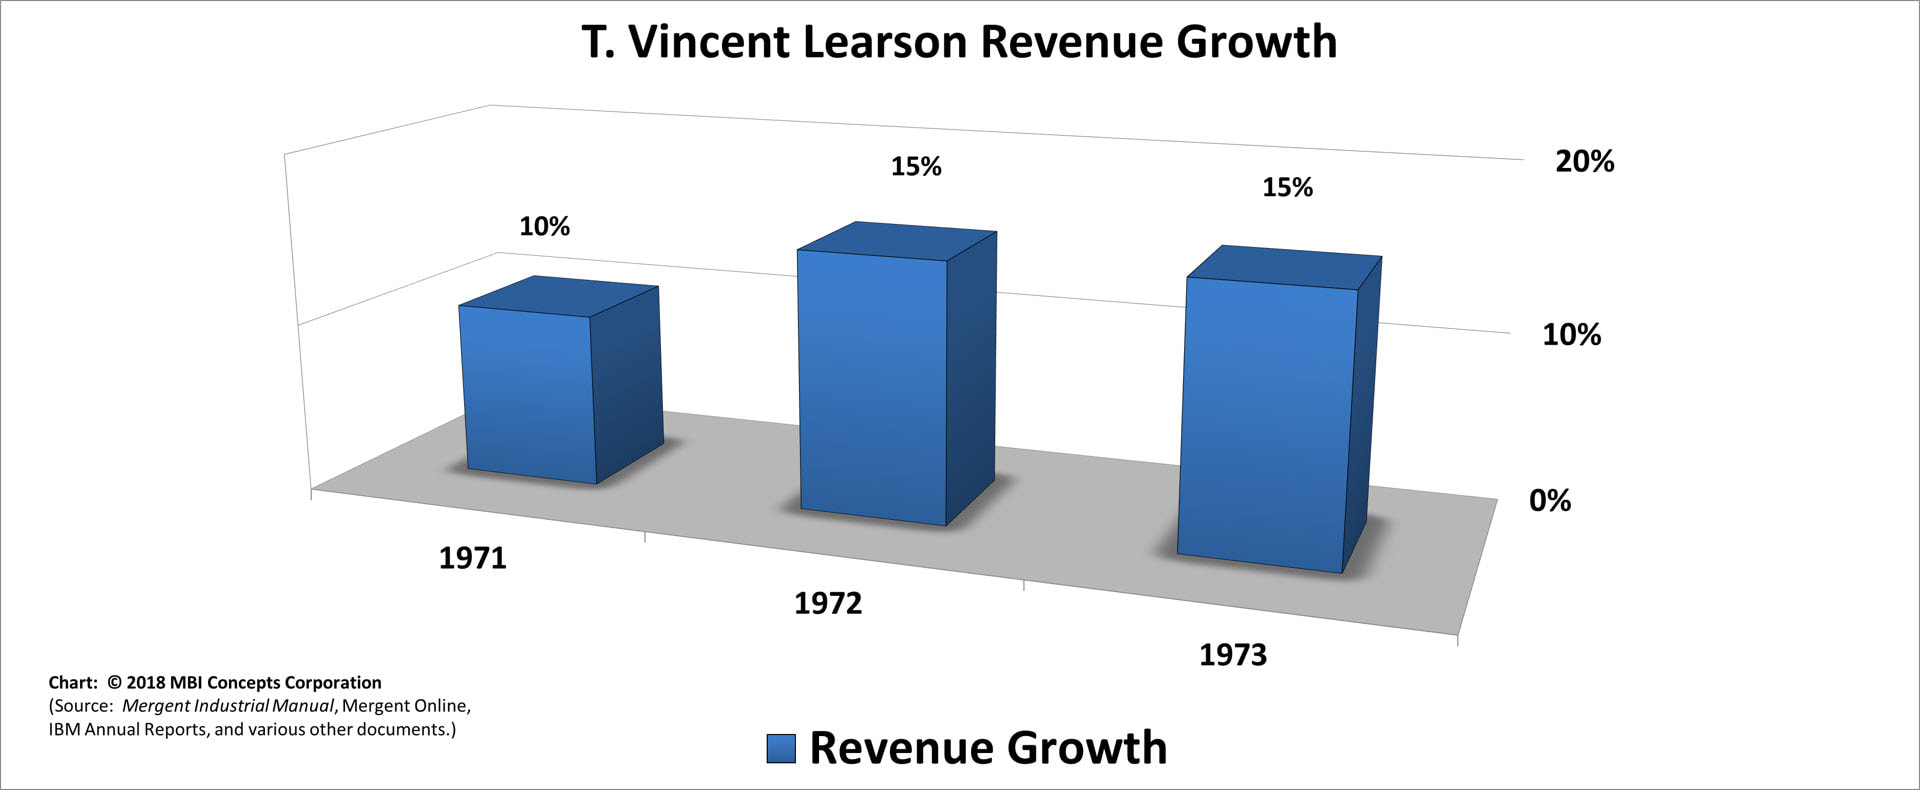
T. Vincent (Vin) Learson: Jun 1971 – Dec 1972 |
- Largest Revenue Growth Increases: 15% (2) and 10%
- Largest Revenue Growth Decreases: not applicable
|
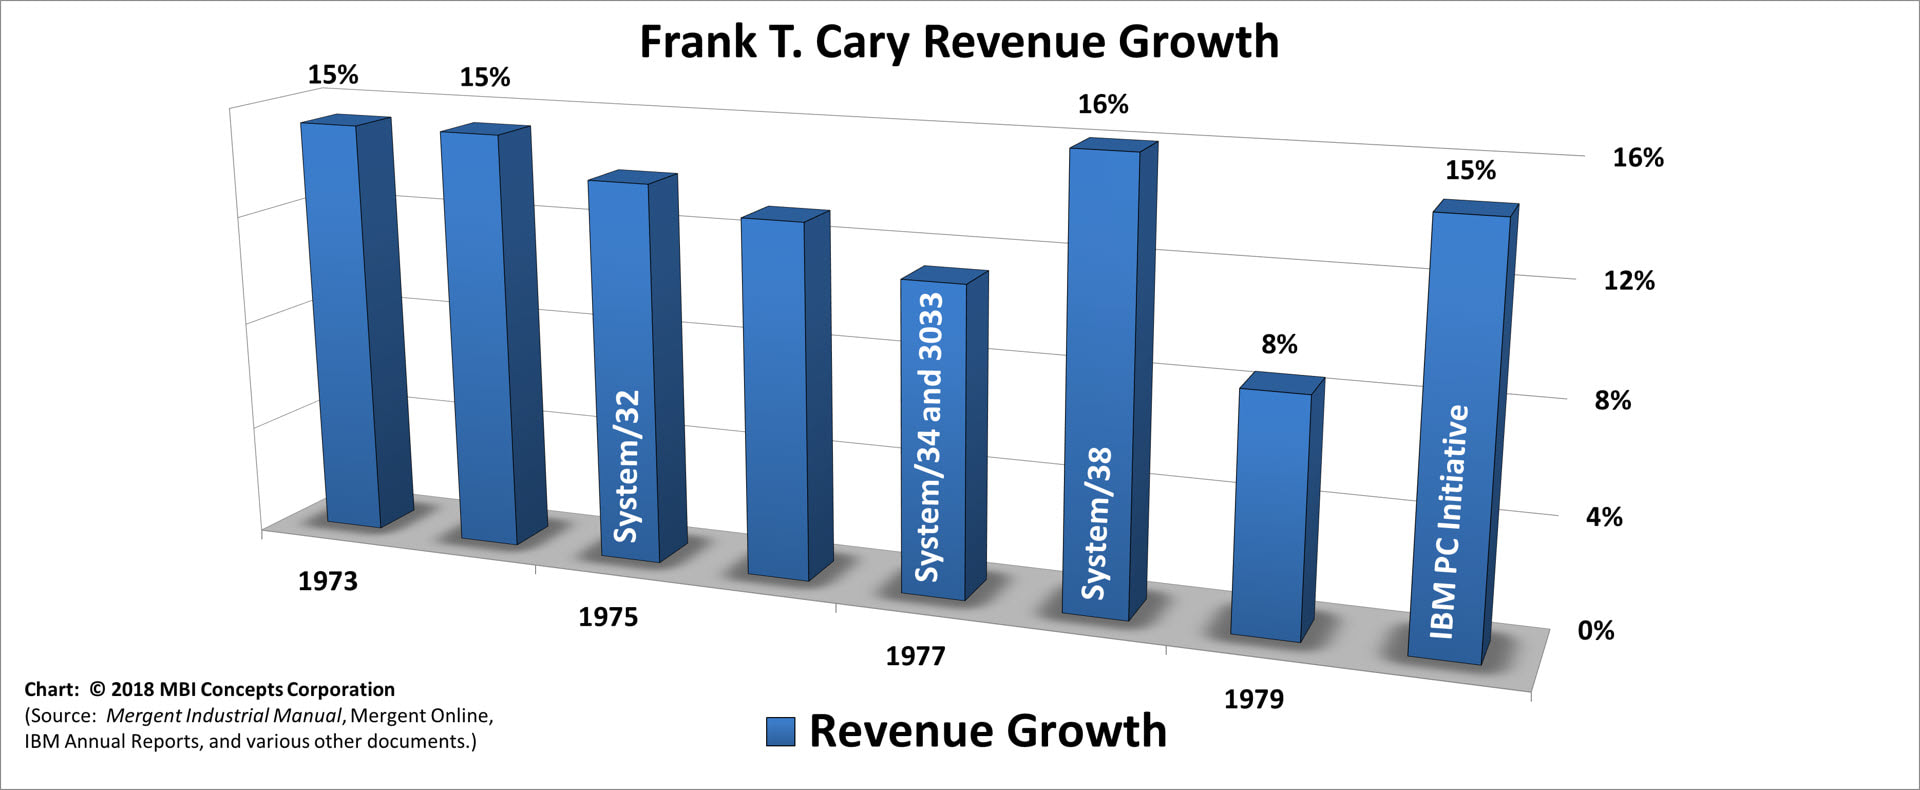
Frank T. Cary: Jan 1973 – Dec 1980 |
- Largest Revenue Growth Increases: 16% and 15% (3)
- Largest Revenue Growth Decreases: not applicable
|
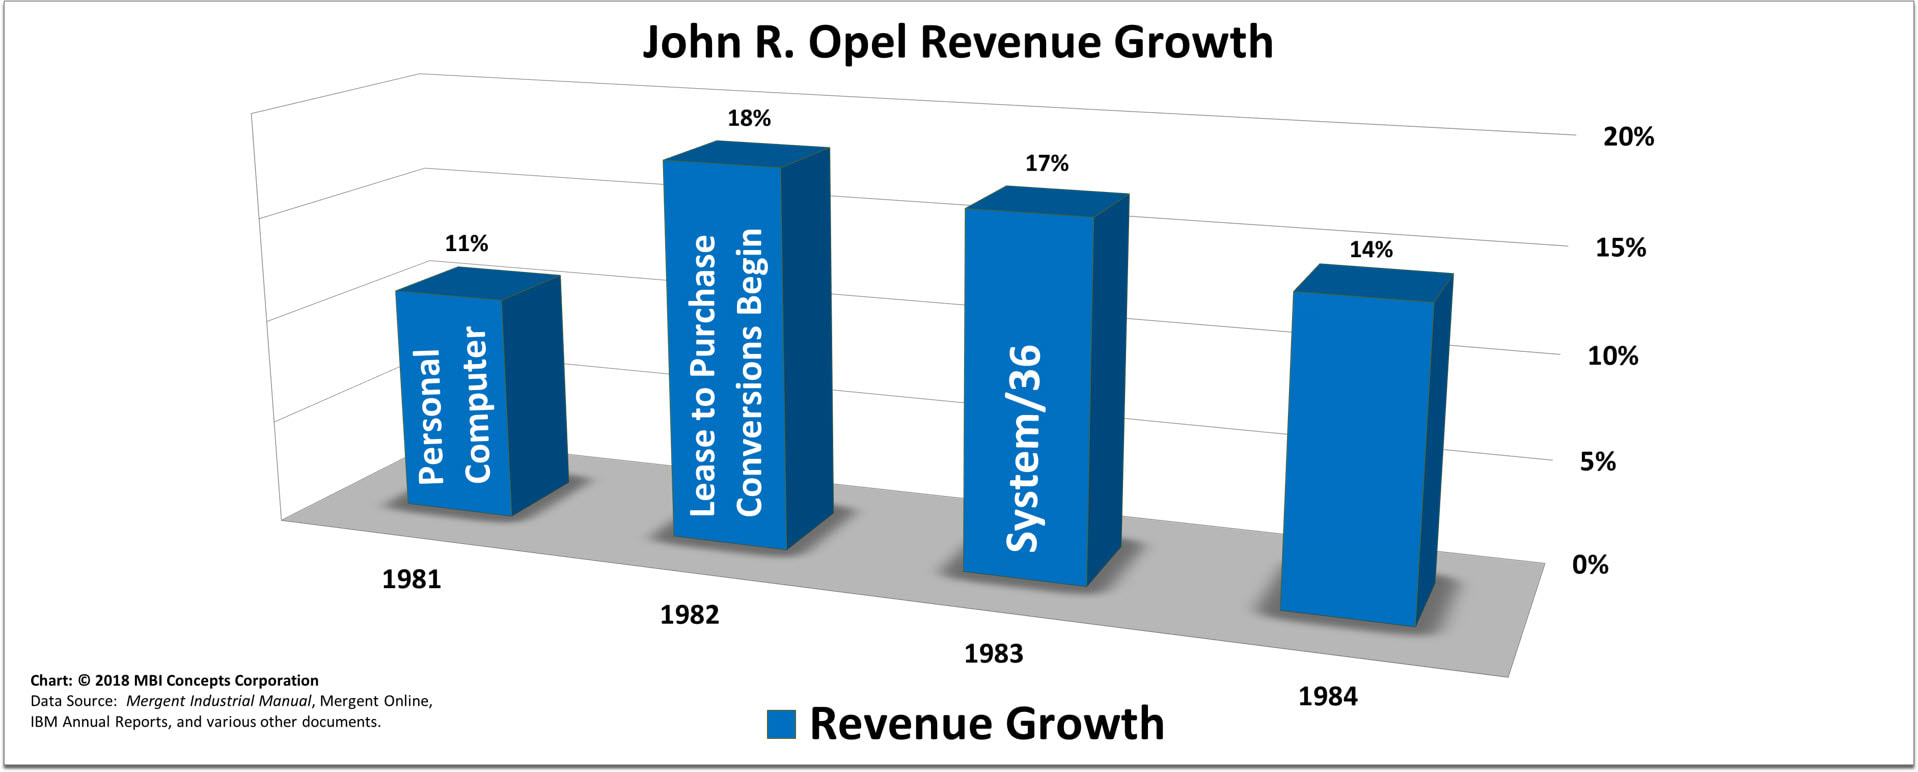
John R. Opel: Jan 1981 – Jan 1985 |
- Largest Revenue Growth Increases: 18%, 17% and 14%
- Largest Revenue Growth Decreases: not applicable
|
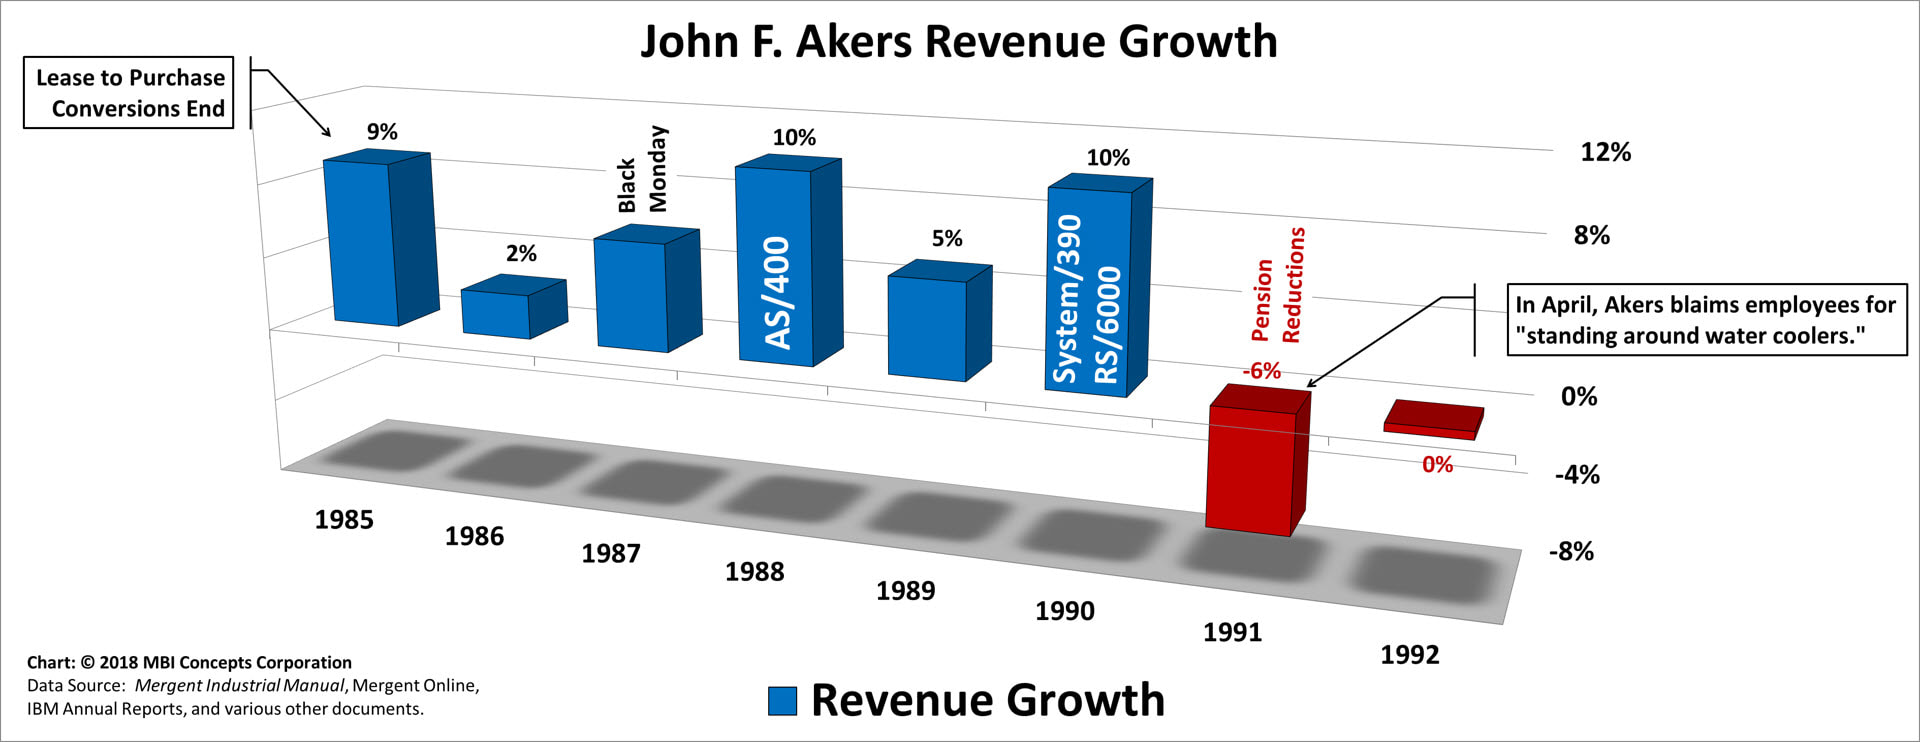
John F. Akers: Feb 1985 – Mar 1993 |
- Largest Revenue Growth Increases: 10% (2) and 9%
- Largest Revenue Growth Decreases: 6%
|
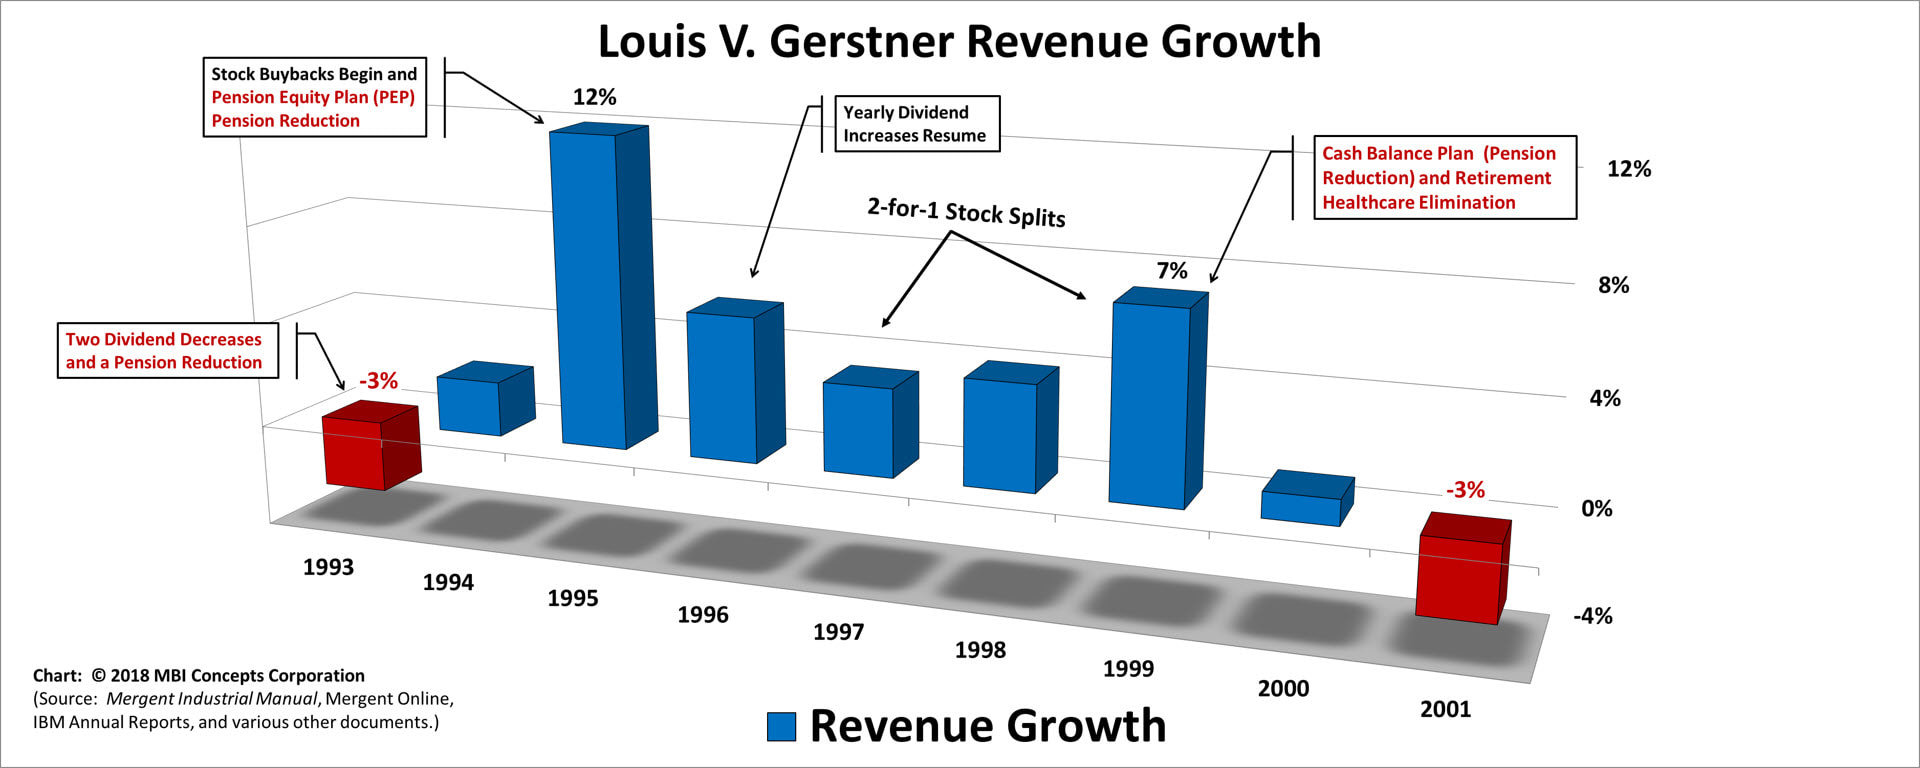
Louis V. (Lou) Gerstner: Apr 1993 – Feb 2002 |
- Largest Revenue Growth Increases: 12% and 7%
- Largest Revenue Growth Decreases: 3% (2)
|
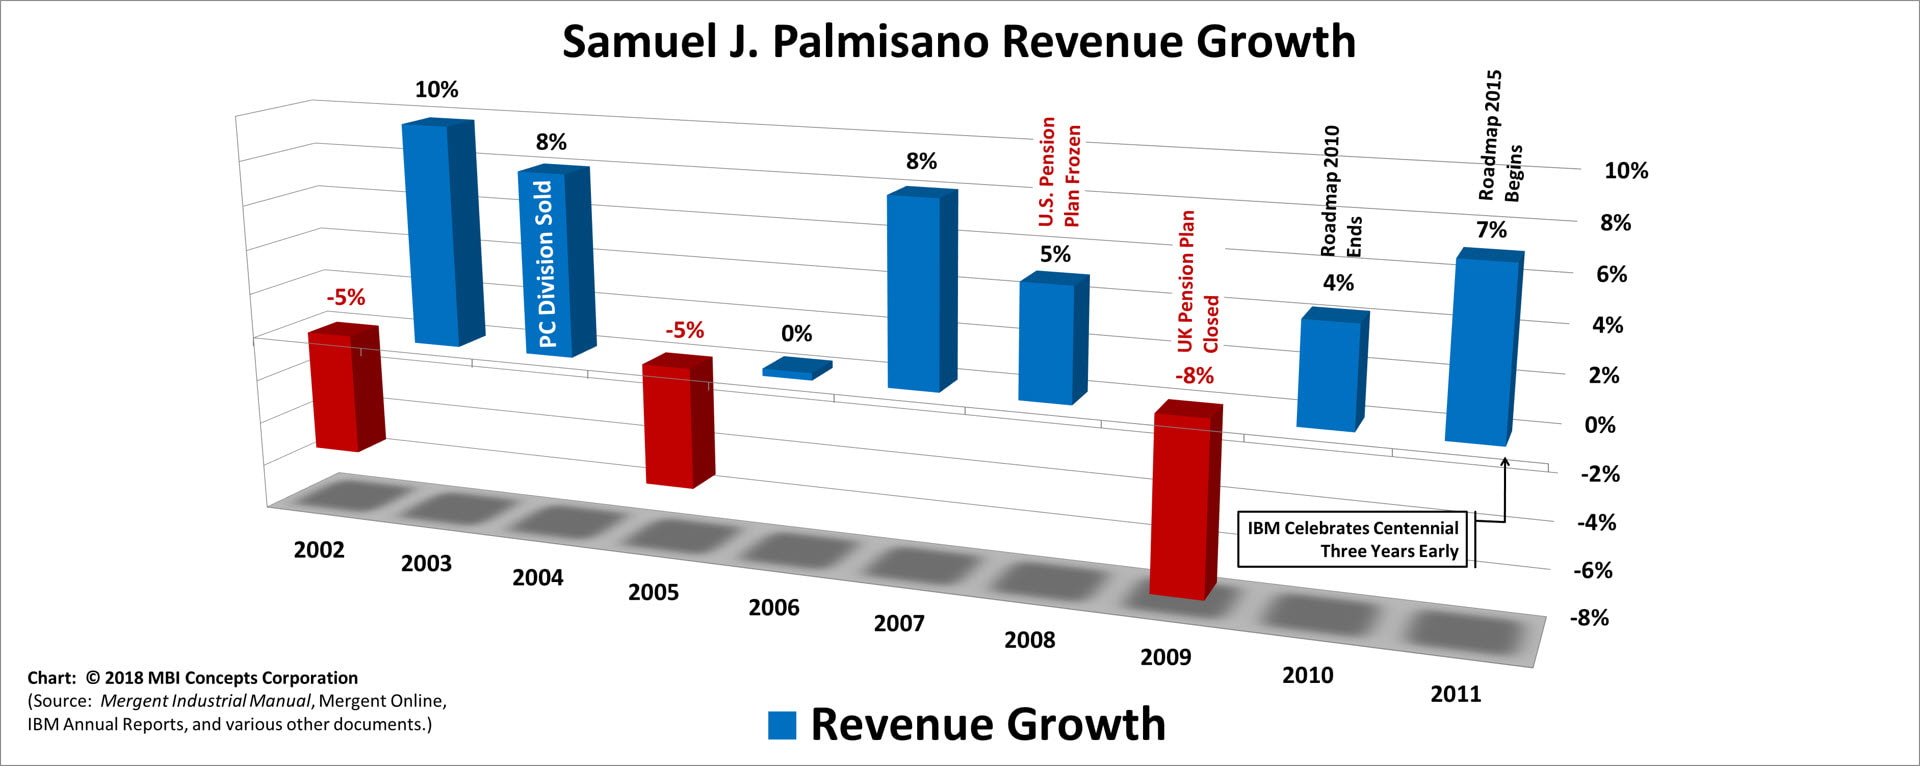
Samuel J. (Sam) Palmisano: Mar 2002 – Dec 2011 |
- Largest Revenue Growth Increases: 10%, 8% (2) and 7%
- Largest Revenue Growth Decreases: 8% and 5% (2)
|
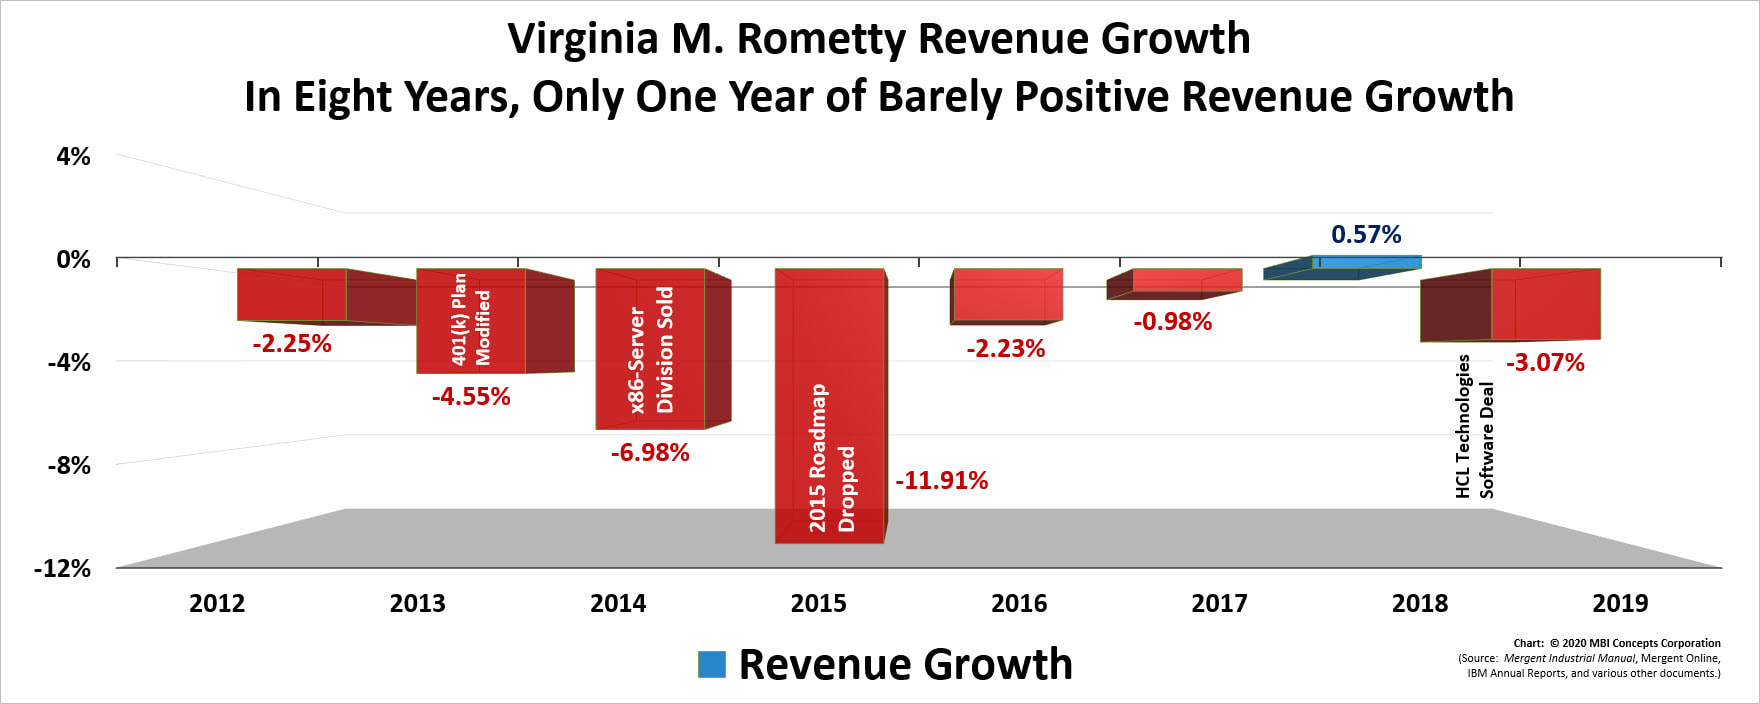
Virginia M. (Ginni) Rometty: Jan 2012 – Mar 2020 |
- Largest Revenue Growth Increases: 0.6%
- Largest Revenue Growth Decreases: 12%, 7%, 5%
Facts worth noting: This is the worst revenue growth performance of any of IBM's chief executive officers.
|
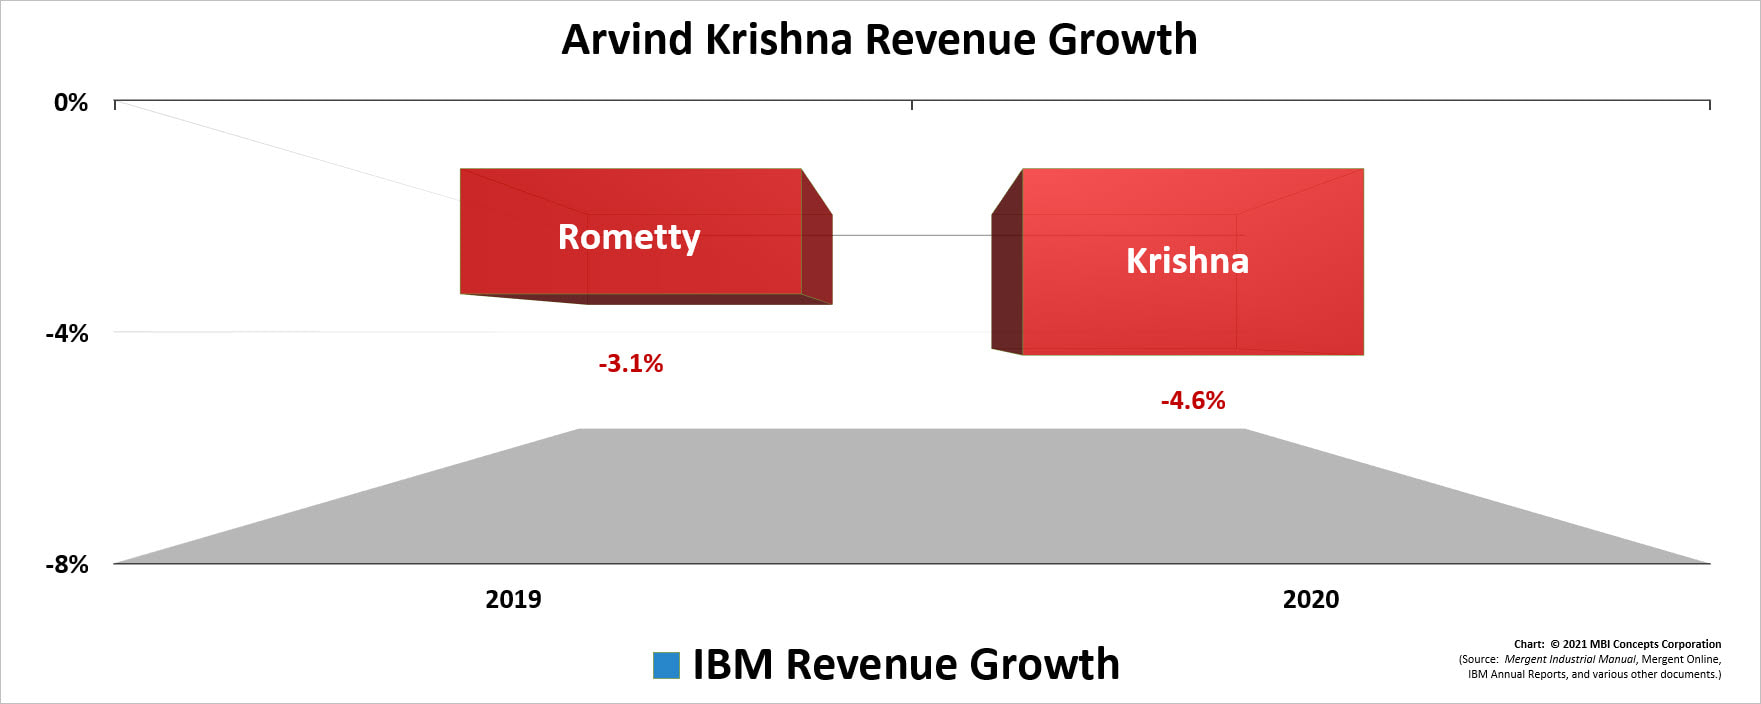
Arvind Krishna: Apr 2020 – Present |
- Largest Revenue Growth Increases: not applicable
- Largest Revenue Growth Decreases: 4.6%
Facts worth noting: In the first quarter of 2020, IBM reported a quarter-to-quarter revenue shortfall of 3.4% ($18.182 billion to $17.571 billion). It noted that “adjusting for divested businesses and currency,” revenue was actually up .1%. Questionably, they did not make any revenue adjustments for its most significant acquisition in the twentieth century—Red Hat. Adjusting for Red Hat, there was a shortfall of 7.8% ($19.061 billion to $17.571 billion) in the combined revenue. This is an additional number they should included when "adjusting" revenue numbers. "Adjustments" to be full disclosure should adjust for both "divested" and "acquired" businesses, not just divested businesses to make the numbers look better for analysts.
This quarterly observation is not made to underscore Arvind and Jim's performance but to highlight the difficult road ahead. The author has a personal dislike of tracking numbers quarter-to-quarter. This is Wall Street using its a ruler to micro-measure performance for quarterly stock price adjustments, when, for long-term investors, a yardstick is more appropriate. At times, even year-to-year may be too short. This author puts strings of years together to evaluate long-term trends and to highlight the results of strategic decisions and their long-term effects.
This quarterly observation is not made to underscore Arvind and Jim's performance but to highlight the difficult road ahead. The author has a personal dislike of tracking numbers quarter-to-quarter. This is Wall Street using its a ruler to micro-measure performance for quarterly stock price adjustments, when, for long-term investors, a yardstick is more appropriate. At times, even year-to-year may be too short. This author puts strings of years together to evaluate long-term trends and to highlight the results of strategic decisions and their long-term effects.
