Profit Growth by IBM CEO
Comparing IBM CEO Profit Growth
|
|
Date Published: August 5, 2021
Date Modified: June 29, 2024 |
"The producer depends for his prosperity upon serving the people. He may get by for a while serving himself, but if he does, it will be purely accidental, and when the people wake up to the fact that they are not being served, the end of that producer is in sight."
Henry Ford, My Life and Work, 1923
IBM Chief Executive Officers' Year-over-Year Profit Growth
Net income (profit) growth is a common metric to determine the success or failure of a Chief Executive Officer. Of course, a percentage rise in net income on a small base appears more significant than a large base. But growth in the early years also brings with it a set of issues, such as the costs of operating on a smaller scale and investing in new markets that a well established institution may not encounter. So it requires more than just these charts to decide on IBM's best leadership, but it is a place to start or strengthen an evaluation. This is just one more piece in assembling a complete picture of IBM's corner office inhabitants.
As Henry Ford might suggest, "Long-term profit performance reflects the amount, duration and quality of service each chief executive provided to their customers."
Based on this criteria, the last two decades at IBM aren't looking very good.
As Henry Ford might suggest, "Long-term profit performance reflects the amount, duration and quality of service each chief executive provided to their customers."
Based on this criteria, the last two decades at IBM aren't looking very good.
Summary of CEO Year-over-Year Profit Growth
|
|
At a Glance: Examining a Century of Year-over-Year Profit Growth
- Largest Profit Growth Increases: Profit growth was positive with only single-year declines from the trough of the Great Depression until the end of the lease-purchase program implemented by John R. Opel [see John Opel's Facts Worth Noting]
- Largest Profit Growth Decreases: The profit of the 21st Century IBM has been muted and erratic
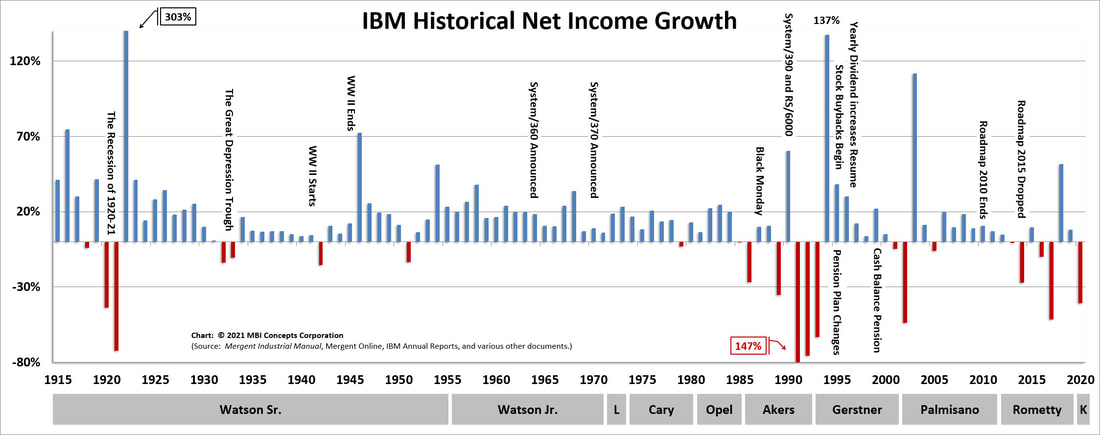
Facts worth noting: I have highlighted some critical historical and business events, as I believe significant economic and political events can answer questions like, "Why did net income grow so fast or slow during this period?" I have also posted up the equivalent revenue growth numbers over the same time frames.
By putting the two together one is able to see the focus of each individual chief executive and the impact of significant events, such as World War II, on the corporation.
By putting the two together one is able to see the focus of each individual chief executive and the impact of significant events, such as World War II, on the corporation.
|
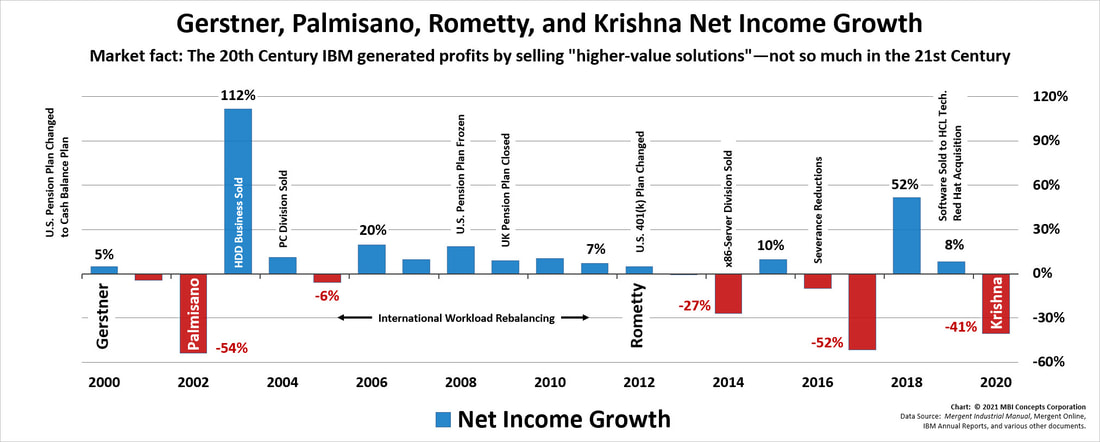
At a Glance: Examining Two Decades of Year-over-Year Profit Growth: 1999 – 2020 |
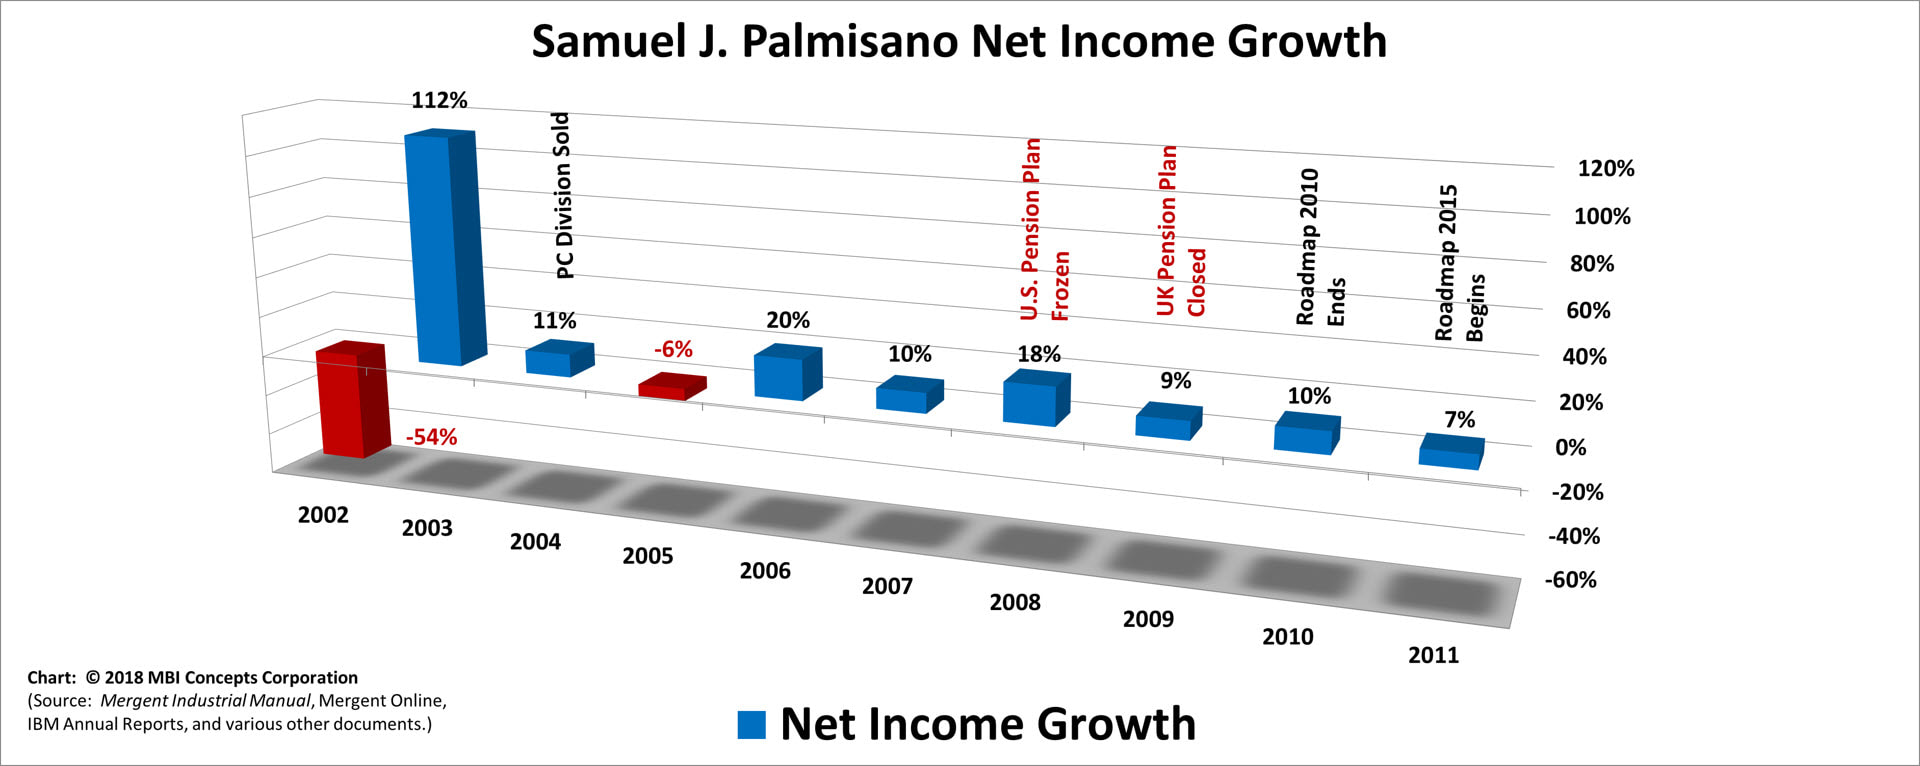
- Largest Profit Growth Increases: 112%, 52%, 20%
- Largest Profit Growth Decreases: 54%, 52%, 41%, 27%
Facts worth noting. Would positive net income growth have been possible from 2006 through 2012 without aggressive bookkeeping (freezing the U.S. pension plan, closing the U.K. pension scheme, and changing the U.S. 401(k) plan) and financial engineering (international workforce rebalancing)?
|
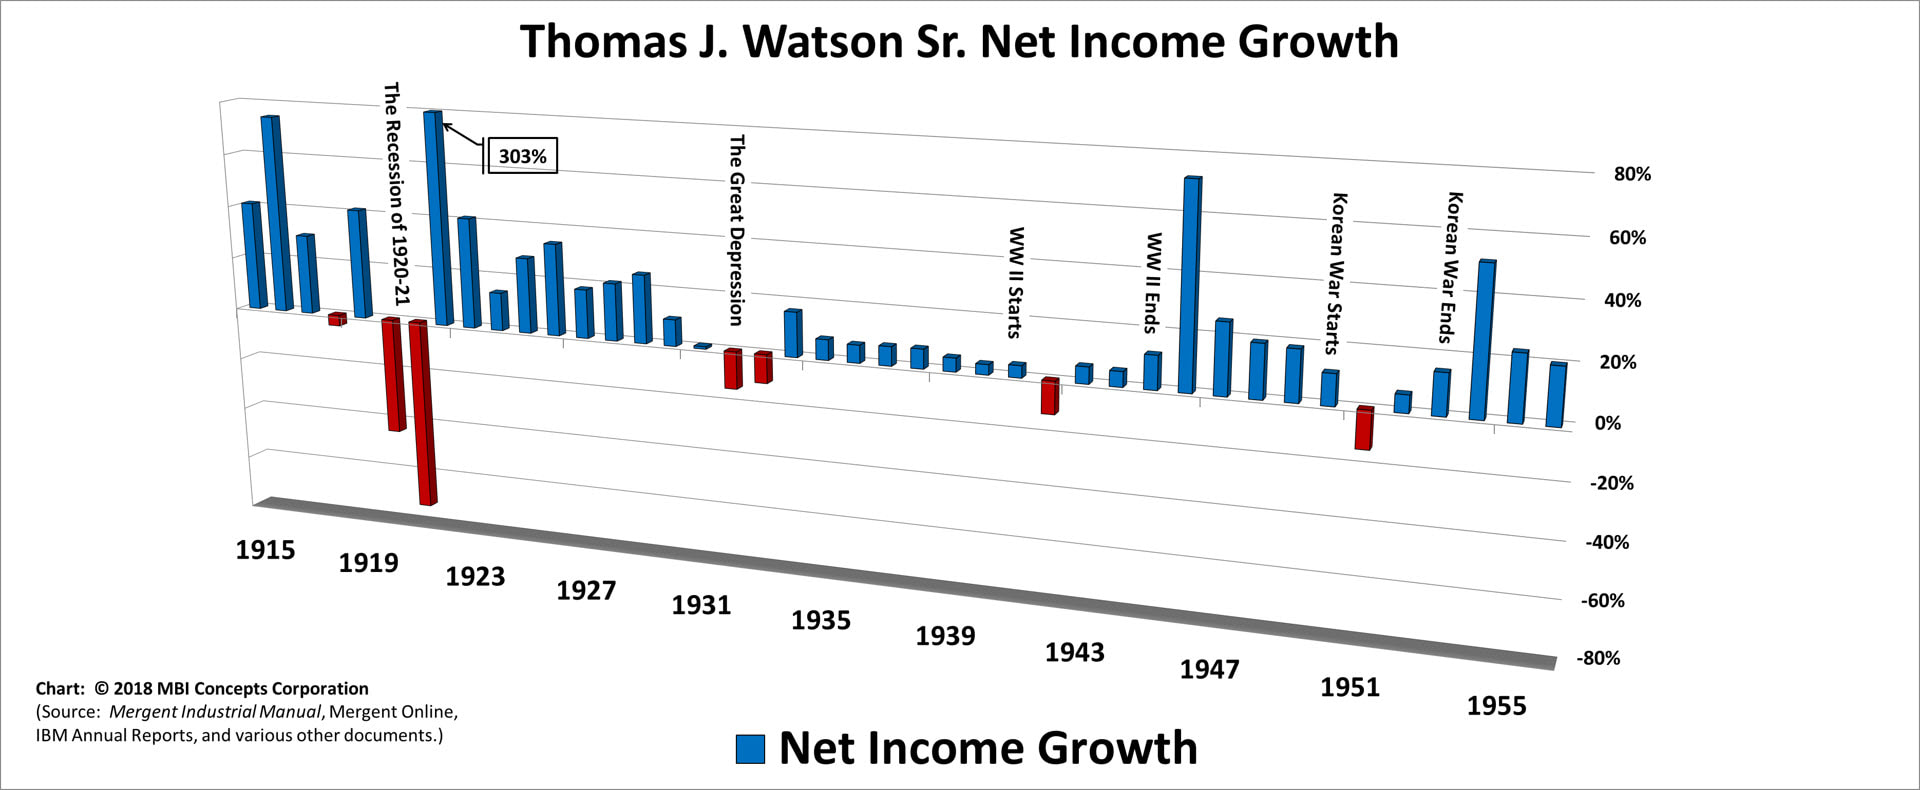
Thomas J. (Tom) Watson Sr.: May 1914 – May 1956 |
- Largest Profit Growth Increases: 303%, 75%, and 73%
- Largest Profit Growth Decreases: 73% and 45%
|
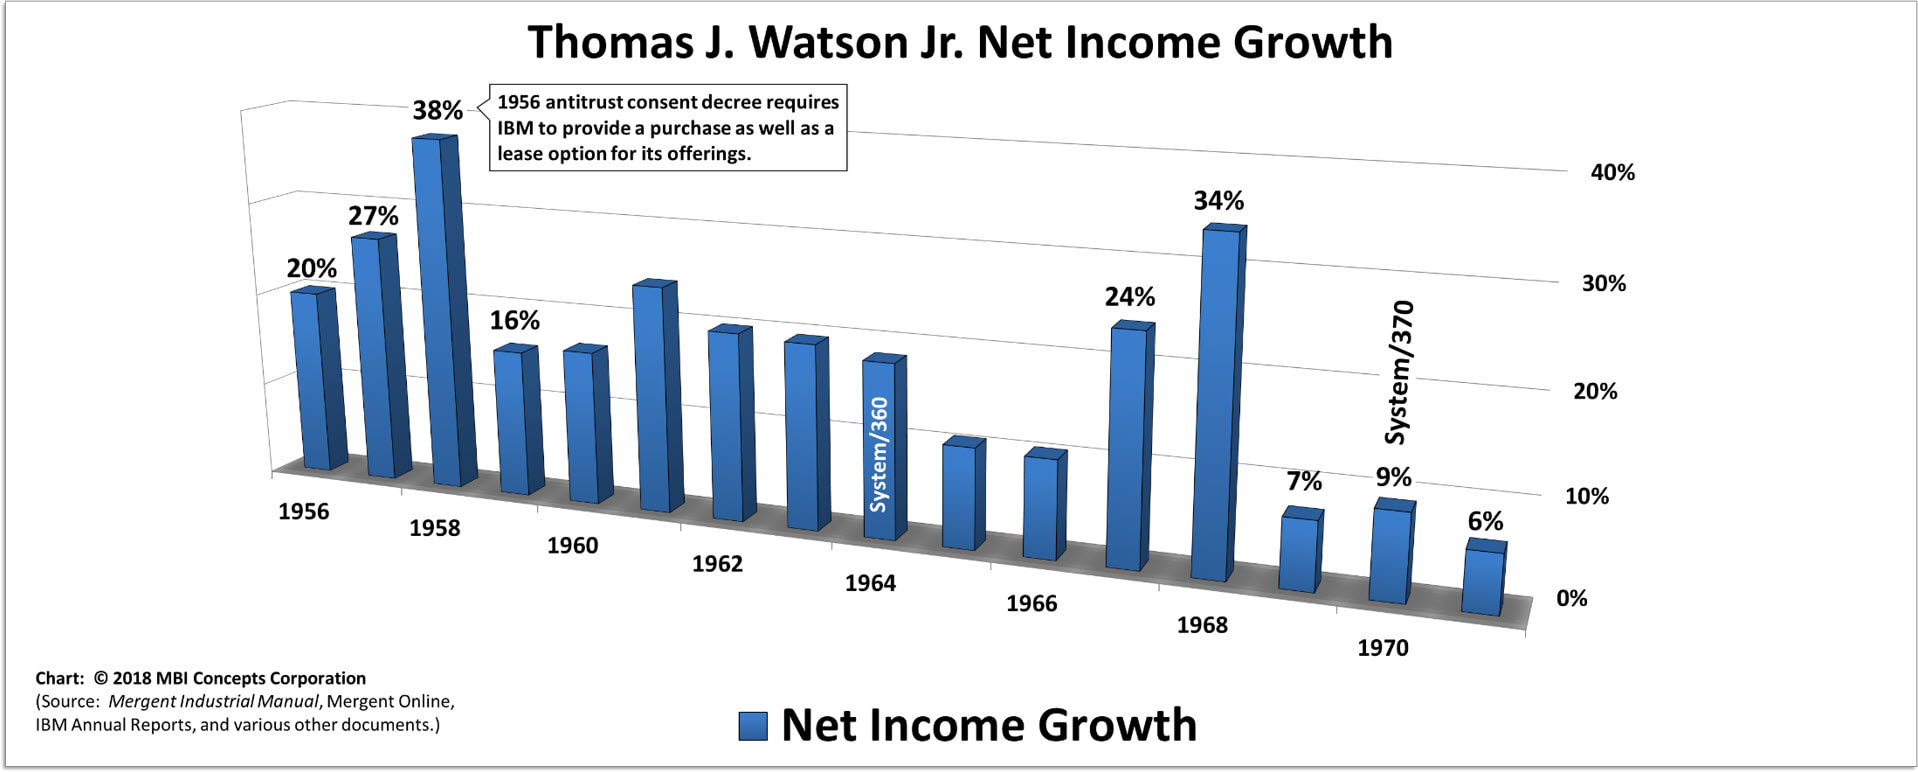
Thomas J. (Tom) Watson Jr.: Jun 1956 – May 1971 |
- Largest Profit Growth Increases: 38%, 34%, and 27%
- Largest Profit Growth Decreases: not applicable
|
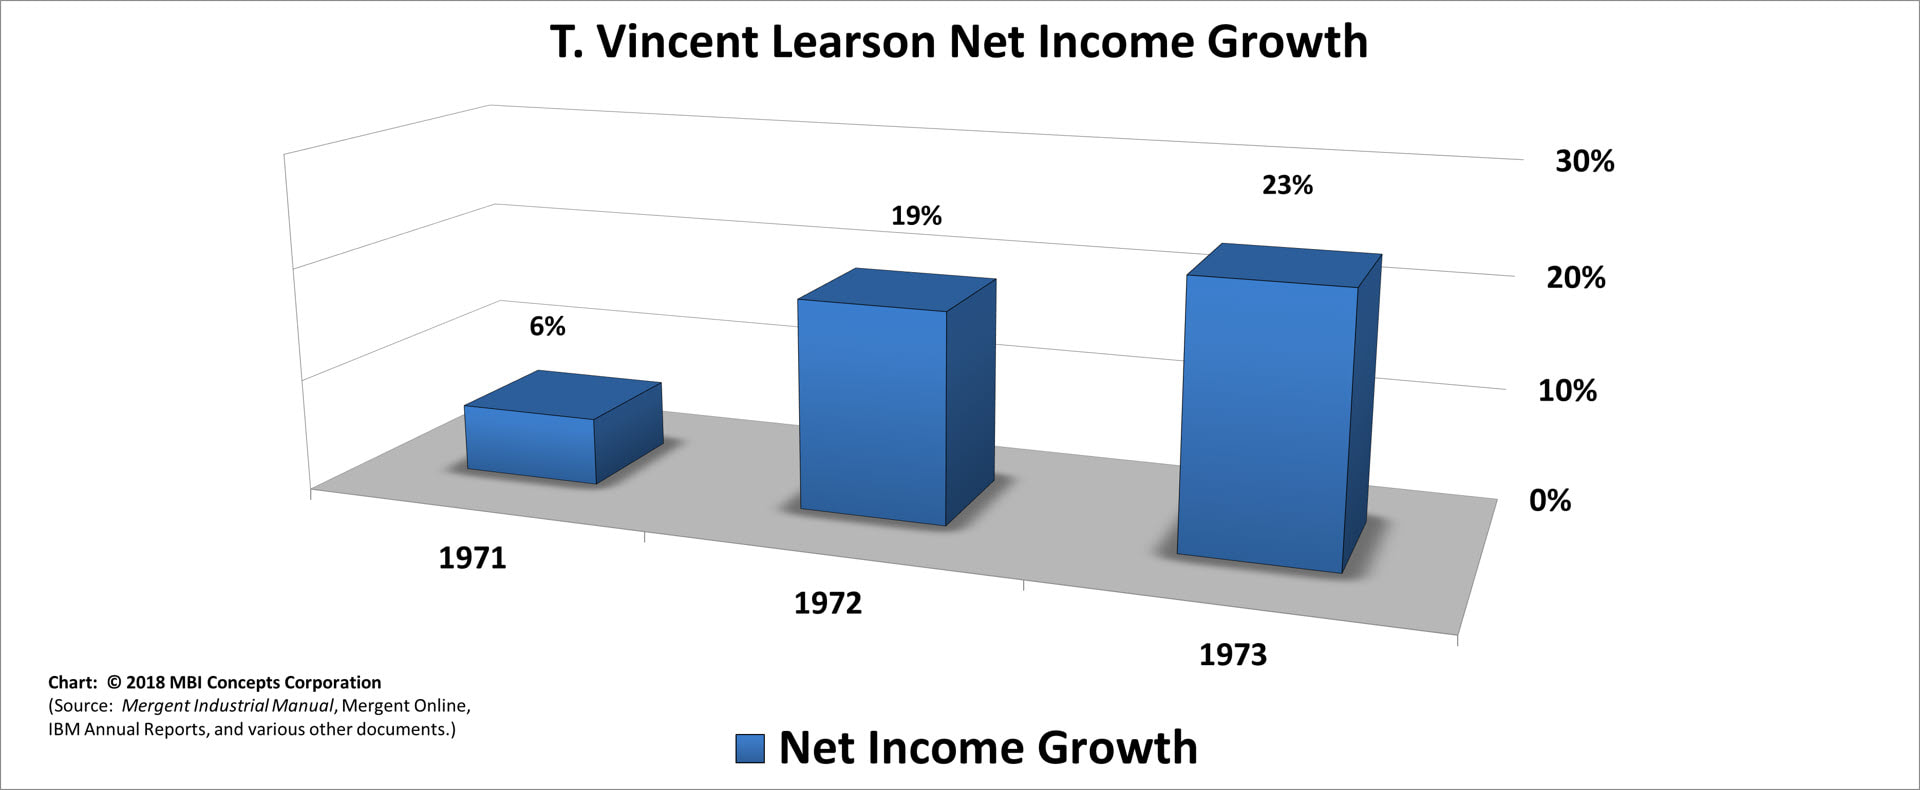
T. Vincent (Vin) Learson: Jun 1971 – Dec 1972 |
- Largest Profit Growth Increases: 23% and 19%
- Largest Profit Growth Decreases: not applicable
|
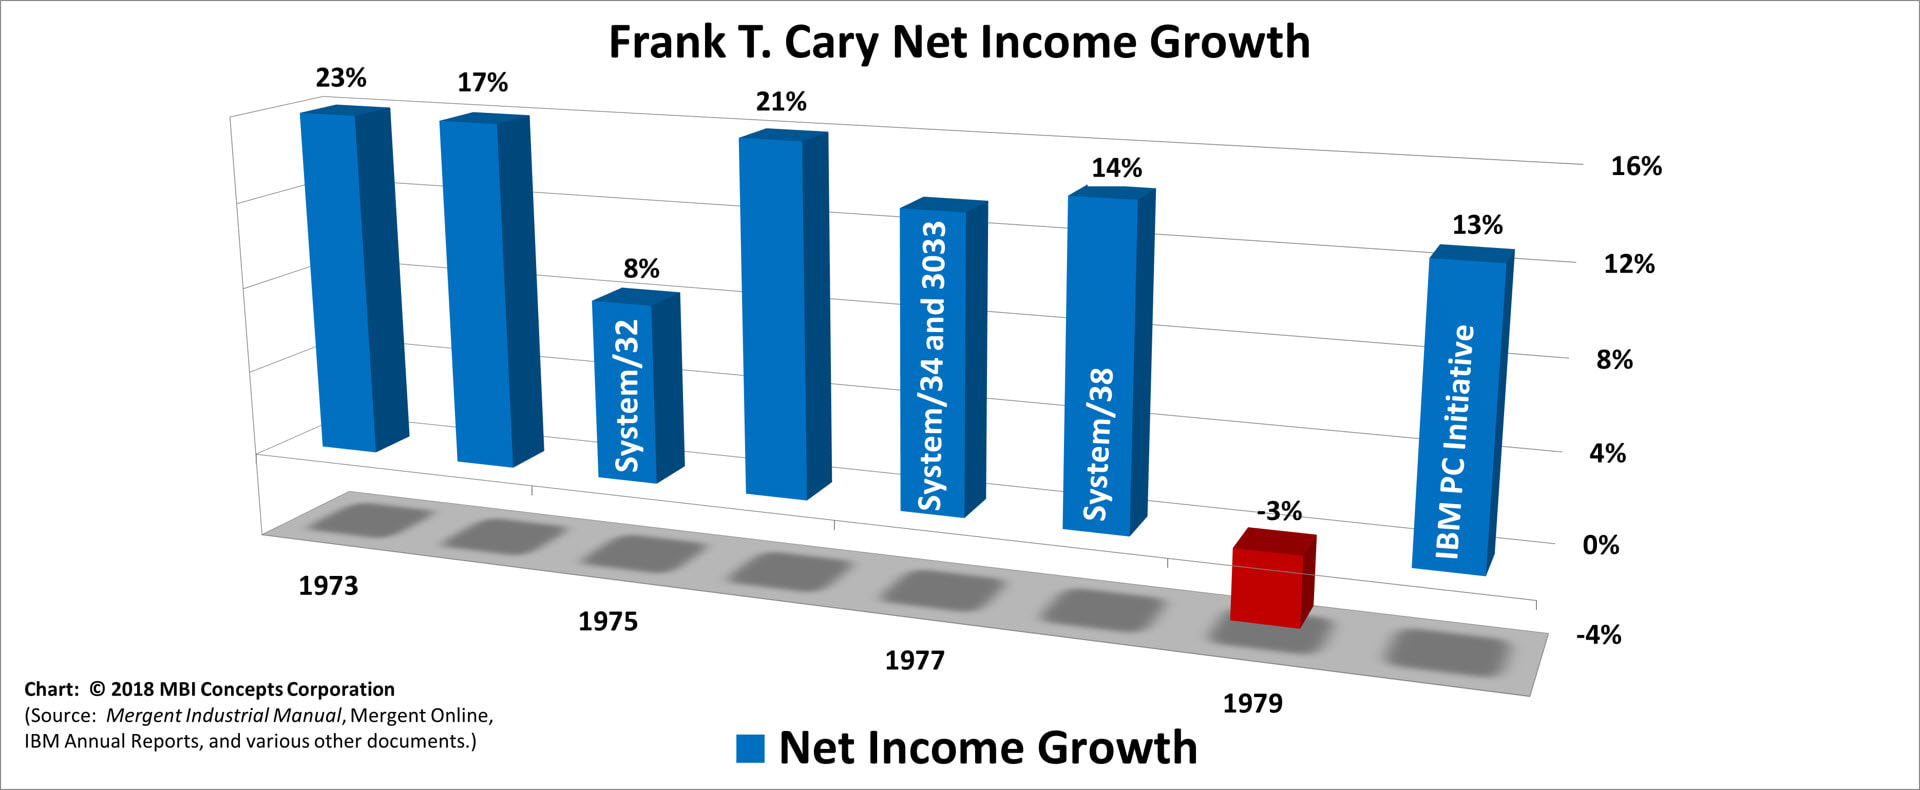
Frank T. Cary: Jan 1973 – Dec 1980 |
- Largest Profit Growth Increases: 23%, 21% and 17%
- Largest Profit Growth Decreases: 3%
|
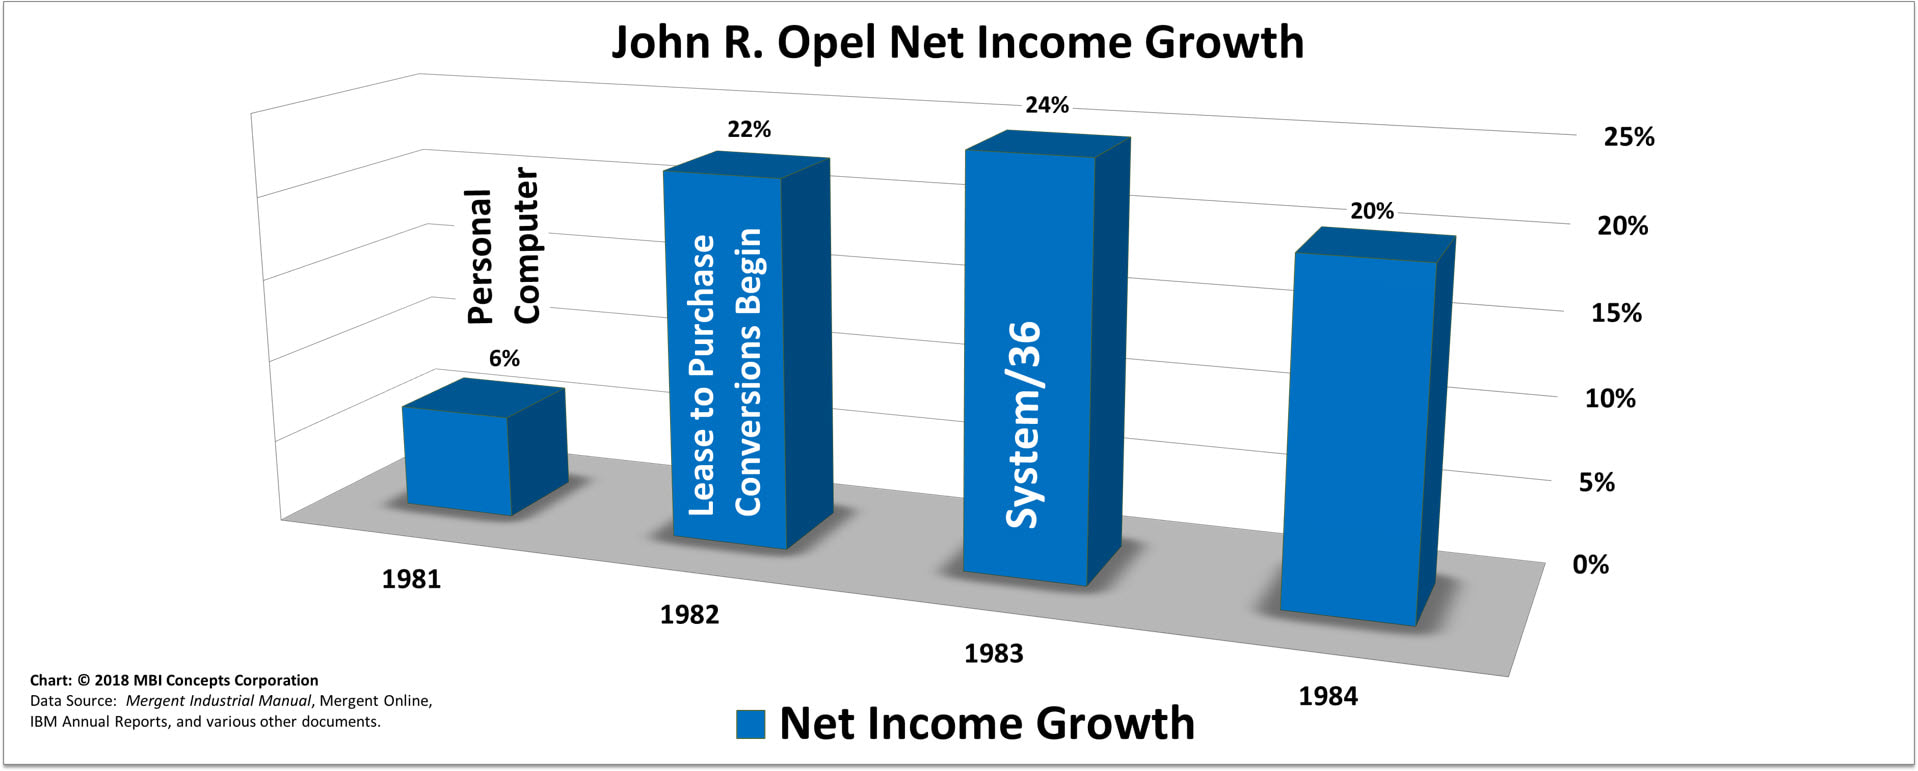
John R. Opel: Jan 1981 – Jan 1985 |
- Largest Profit Growth Increases: 24%, 22% and 20%
- Largest Profit Growth Decreases: not applicable
Facts worth noting: In 1982, John R. Opel started to convert IBM's business from a lease/rental base to purchase-only. One effect of this effort was to pull in revenues and profits from out years into a short, compressed three-year period from 1982 to 1984. The effect of such a conversion on profits and revenues can be seen best during Watson Jr.'s time as chief executive (chart above) when profit rose by 20%, 27% and 38%, and revenues rose by 28%, 35% and 18% in 1956, 57 and 58, respectively.
During this time, the conversion was "forced" on the company by the Anti-trust Consent Decree of 1956. As part of the agreement, IBM was required to offer both lease and purchase options. As Watson Jr. predicted at the time, the effect was short lived. Unlike Watson Jr., John Opel never told the analysts or shareholders about this first form of "government enforced" financial engineering at IBM: following a short-term, financially expedient path at the expense of the long-term health of the business. Rather than controlling expectations, he promised a $100 Billion IBM by 1990 and a $180 Billion IBM by 1994. What was the effect?
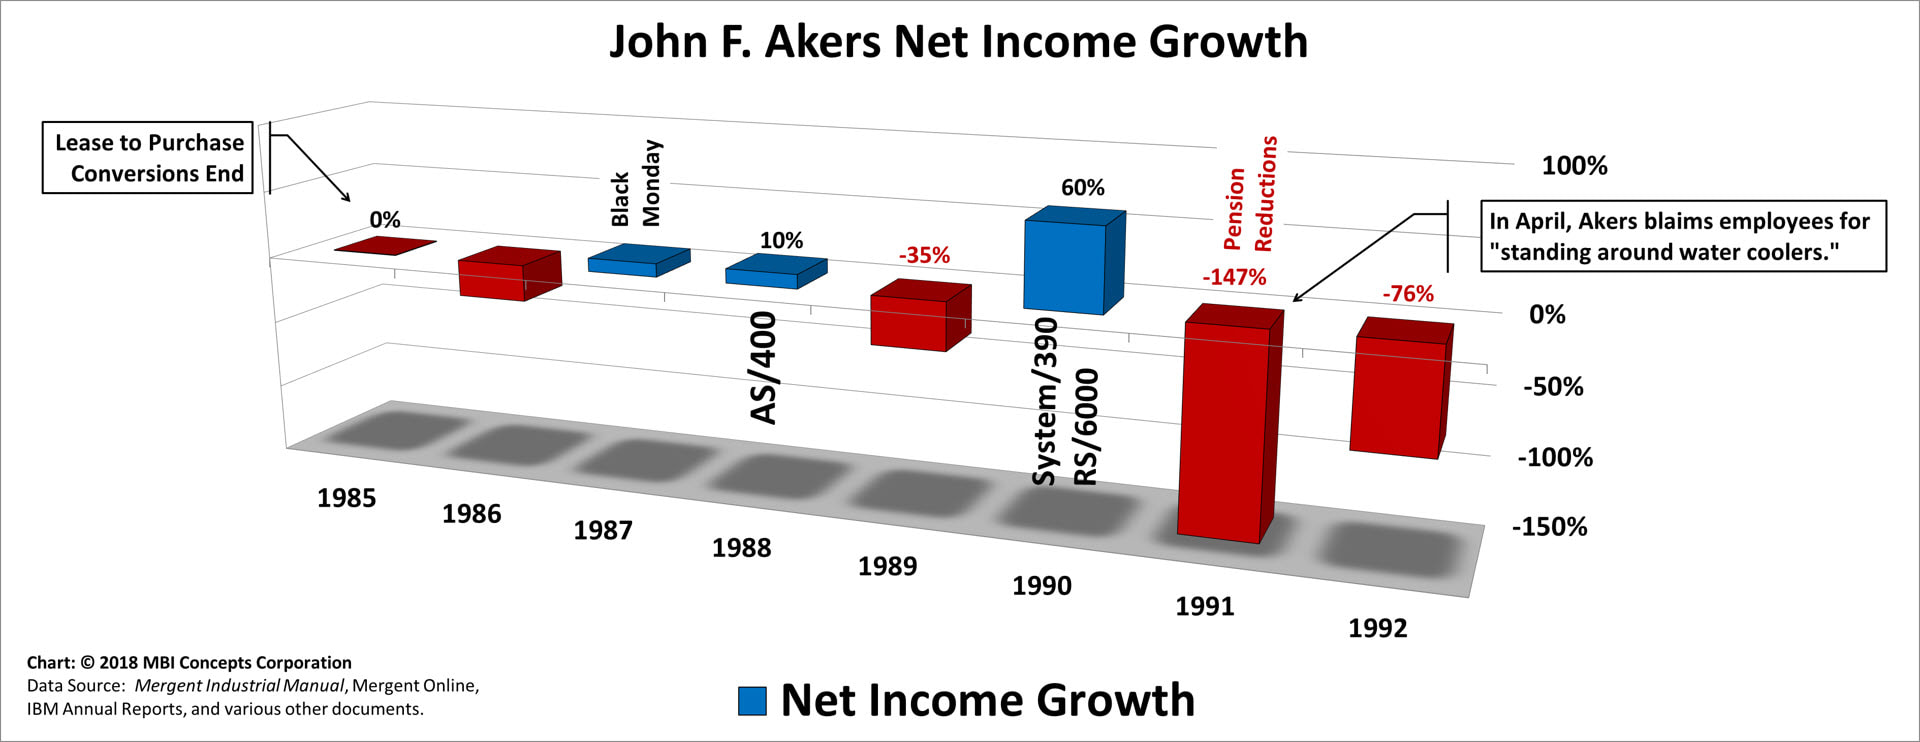
Look at his predecessors struggle with maintaining consistent profit growth in the chart below. John Akers' term as chief executive started with 0% net income growth in 1985 and a 27% decline in 1986 after the lease to purchase conversion had run its course. If a successful CEO is determined by "good timing," John Opel's timing was extremely fortuitous. Don't feel too sad for John Akers, though, as he had been sitting next to Chairman Opel since 1982 as IBM's President. He should have known what was coming.
It had nothing to do with the feet on the street "standing around water coolers."
|
John F. Akers: Feb 1985 – Mar 1993 |
- Largest Profit Growth Increases: 60% and 10%
- Largest Profit Growth Decreases: 147%, 76% and 35%
Facts worth noting: John Akers was forced to live with market expectations set by his predecessor in BusinessWeek's "IBM: More Worlds to Conquer:" a $100 Billion IBM by 1990 and a $180 Billion IBM by 1994. It was only a few months into his time in the corner office that he was forced to acknowledge that these expectations could not be met.
As the [BusinessWeek] article rolled off the presses, John Akers became IBM’s chief executive officer. In June, only four months later and only five minutes into a speech with Wall Street analysts, he told them, “Achieving the solid growth we expected for 1985 is now unlikely.” Obviously, to go in a single quarter from a corporation setting its sights on $180 billion to one that can’t meet its growth forecasts caused a stir. David E. Sanger, a business reporter for The New York Times, wrote, “Two wire-service reporters quietly slipped out of the room, breaking into a run once they were out of earshot. A half-hour later … IBM’s stock had started to plummet. By day’s end it was down five points, taking the entire stock market with it … the next day the market dropped another 16 points.”
It is truly hard, though, to feel sorry for a chief executive that had the AS/400, RS/6000 and System/390 ship during his time in the corner office—the latter two offerings delivered a 60% increase in profits in one year. This was an individual who found defeat in the face of certain victory.
If anybody was doing their jobs during this time it was the feet on the street: branch office sales, product management, brand management, development and production.
The water cooler must have been in the director's board room.
|
Louis V. (Lou) Gerstner: Apr 1993 – Feb 2002 |
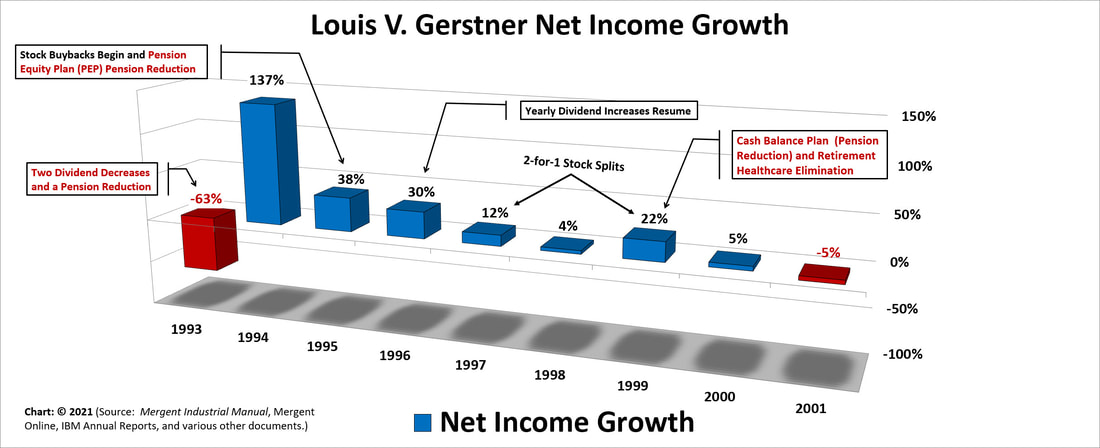
- Largest Profit Growth Increases: 137%, 38% and 30%
- Largest Profit Growth Decreases: 63% and 5%
|
Samuel J. (Sam) Palmisano: Mar 2002 – Dec 2011 |
- Largest Profit Growth Increases: 112%, 20% and 18%
- Largest Profit Growth Decreases: 54% and 6%
|
Virginia M. (Ginni) Rometty: Jan 2012 – Mar 2020 |
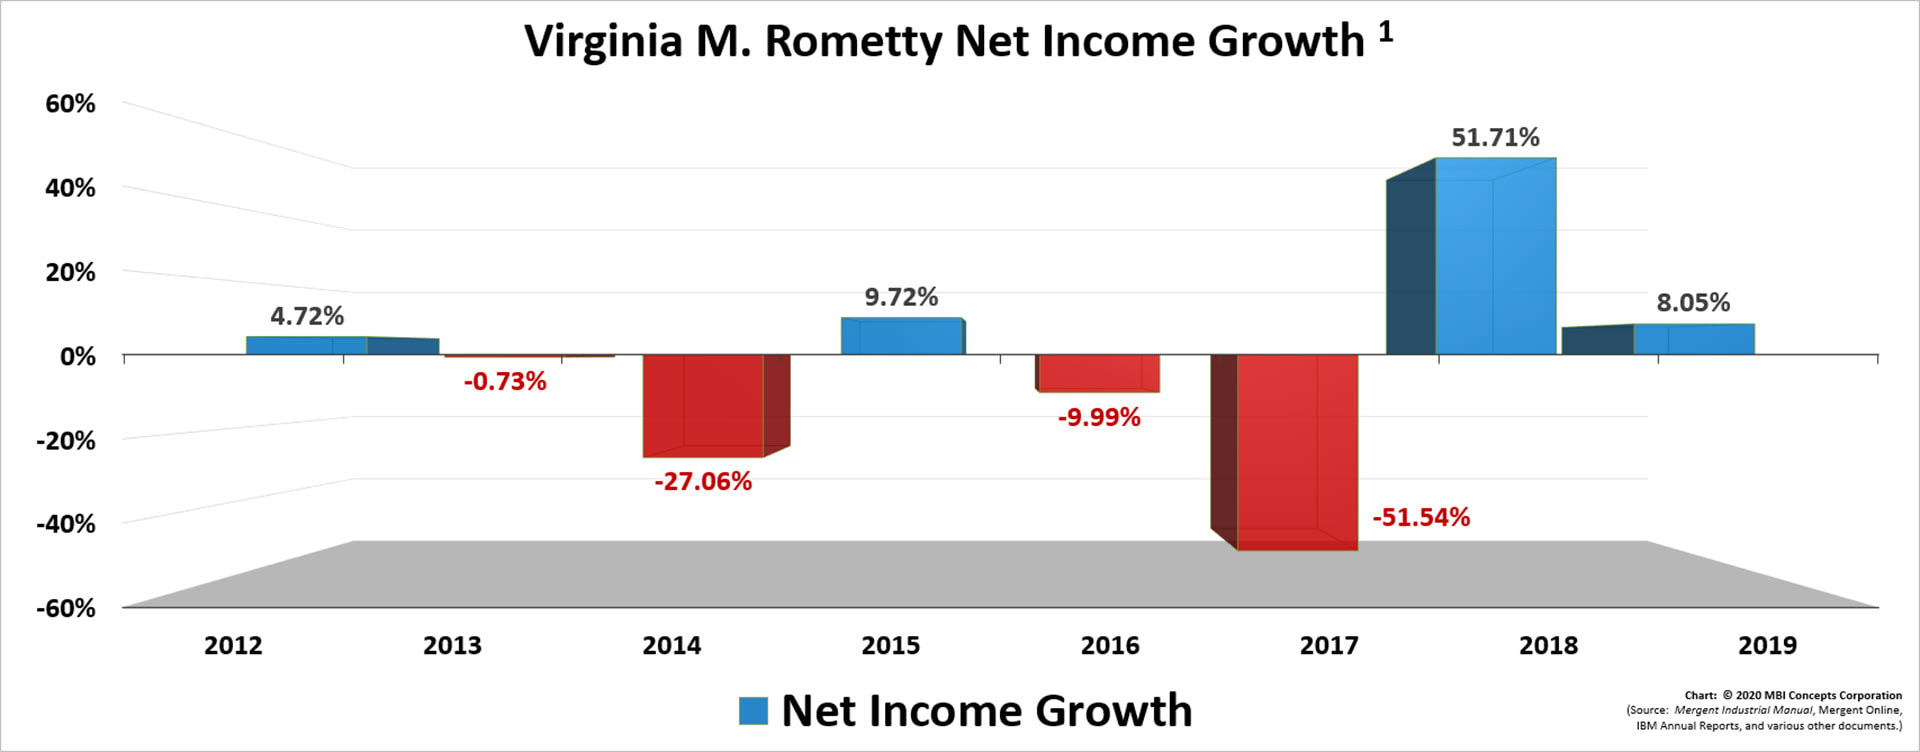
- Largest Profit Growth Increases: 52%, 10% and 8%
- Largest Profit Growth Decreases: 52%, 27% and 10% [See Footnote]
Facts worth noting: In the IBM 2010 Annual Report the following three conditions were set to achieve the 2015 EPS Roadmap: (1) revenue growth: a combination of base revenue growth, a shift to faster growing businesses and strategic acquisitions, (2) operating leverage: A shift to higher-margin businesses and enterprise productivity derived from global integration and process efficiencies, and (3) share repurchase: leveraging a strong cash generation to return value to shareholders by reducing shares outstanding.
Obviously, Ginny Rometty failed to make the shift to higher-margin businesses as profit growth was all over the place and only supported with the selling of the x86-Server Division in 2014.
[Footnote]: It may seem counter-intuitive, but a 50% increase in profits (2018) following a 50% decrease (2017) does not balance out. Net income fell 50% from $12 billion to $6 billion in 2017. It then increased 50% from $6 billion to $9 billion.
Overall, yearly net income was still down by $3 billion.
|
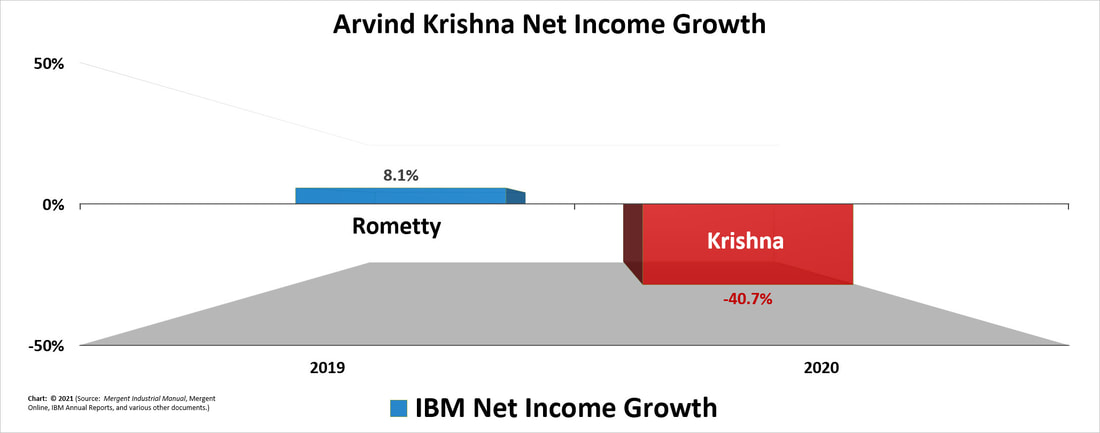
Arvind Krishna: Apr 2020 – Present |
- Largest Profit Growth Decreases: 40.7%
