Lou Gerstner wrote, "People truly do what you inspect, not what you expect." … Lest we forget, these "inspection pages" exist because chief executives are "people" too.
Arvind Krishna's First-Year Shareholder Returns and Risk
- Evaluating Arvind Krishna's First-Year Shareholder Returns
- IBM Shareholder Trust and Transparency
- Arvind Krishna's First-Year Shareholder Returns by the Numbers
- Evaluating Arvind Krishna's First-Year Shareholder Risk
- Arvind Krishna's First-Year Shareholder Risk by the Numbers
Evaluating Arvind Krishna's First-Year Shareholder Returns
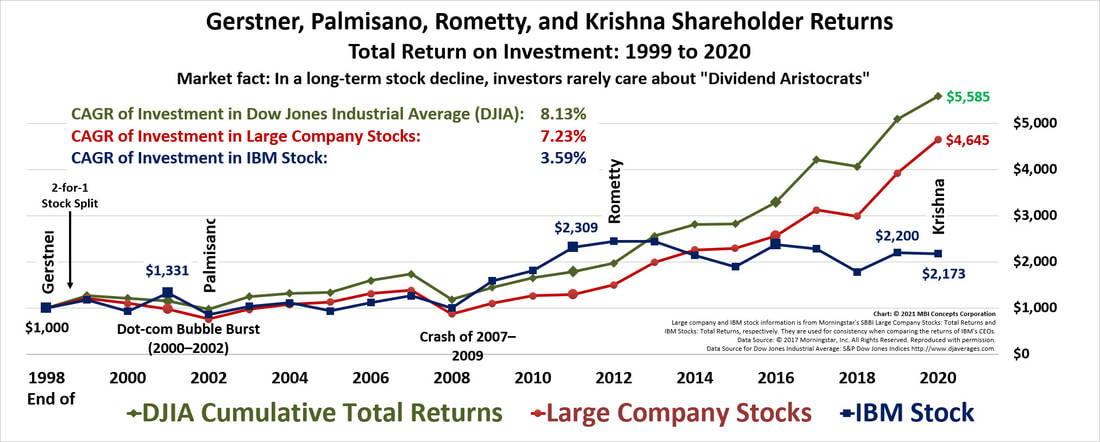
What were Arvind Krishna's first-year, 2020 shareholder returns—including dividends? IBM stock—including dividends—was down 1.2% while the Dow Jones Industrial Average (DJIA) was up 9.72%, and a large company stock index fund was up 18.4%. While it continued to be a "Dividend Aristocrat" as far as dividend payments, it also continued an nine-year run as a "Dog of the Dow."
Unfortunately, to discover this yearly underperformance, an IBM shareholder would have to turn to page 141 of IBM's 143-page 2020 Annual Report. The government requires it . . . but, evidently, there were no legal requirements on where and how it was to be added.
So, the company did the minimum necessary to meet legal requirements.
|
IBM Shareholder Trust and Transparency |
|
The IBM Chairman’s 2020 “Letter to Investors” covered:
|
IBM's 2020 Annual Report documents the following shareholder returns in 2020: IBM: 1.2% loss; S&P 500: 18.3% gain; S&P Technology Index: 43.9% gain.
|
Above is the chart that IBM included in its 2020 Annual Report - Card.
This information is required by law, and it documents the corporation’s underperformance in 2020 and over the previous five years. It shows a shareholder’s return on a $100 dollar investment in IBM common stock with all dividends reinvested. IBM's returns are the solid blue flatline.
This chart was on page 141 of the company’s 143-page report . . . as far from the "Letter to Investors" as possible.
This is the equivalent of a salesman withholding his end-of-year attainment to the last chart in a hundred-chart PowerPoint presentation—only revealing that he failed to make quota after his management team had fallen into a deep stupor of boredom.
This is not good form from a corporation that claims it can be trusted to be transparent, and that it wants to build confidence in its leadership and their ethical standards.
This is not good form from a corporation that claims it can be trusted to be transparent, and that it wants to build confidence in its leadership and their ethical standards.
Arvind Krishna's First-Year Shareholder Returns by the Numbers
- Krishna 2020 Shareholder Returns: Down 1.2%
- Krishna & Rometty 2012–20 Shareholder Returns: Down 5.9%
- Krishna, Rometty, Palmisano & Gerstner 2000–20 Shareholder Returns:
- Generally underperforming but positive returns until Ginni Rometty took charge, then the stock consistently underperformed lower-risk, index investments
Evaluating Arvind Krishna's First-Year Shareholder Risk
An intangible asset is something that, if dropped on your toe, doesn’t leave a mark. It is ethereal, and its value is open to personal interpretation, imagination, and creative thinking. For the purposes of this article, intangible assets are presented in two ways: first, the goodwill that arises directly from an acquisition; and second, all other intangible assets—patents, brand image, customer relations, non-binding contracts, strategic alliances, or others (from IBM's Annual Reports).
Goodwill is the difference between the full amount paid for an acquisition less all other tangible and intangible assets. For instance, in its 2003 annual report, IBM documented the 2002 acquisition of PricewaterhouseCoopers Consulting (PwCC) for $3.89 billion. Of the purchase price, IBM estimated that PwCC had $.32 billion in tangible assets (current and fixed assets — chairs, desks, computers, buildings, etc. — less current and non-current liabilities), and $.41 billion in “other” intangible assets (strategic alliances, client relationships, and customer contracts). The remaining $3.16 billion — 81% of the purchase price — was listed as goodwill: specifically, the value of the acquired assembled workforce, synergies gained from combining PwCC and IBM, and the premium paid to gain control.
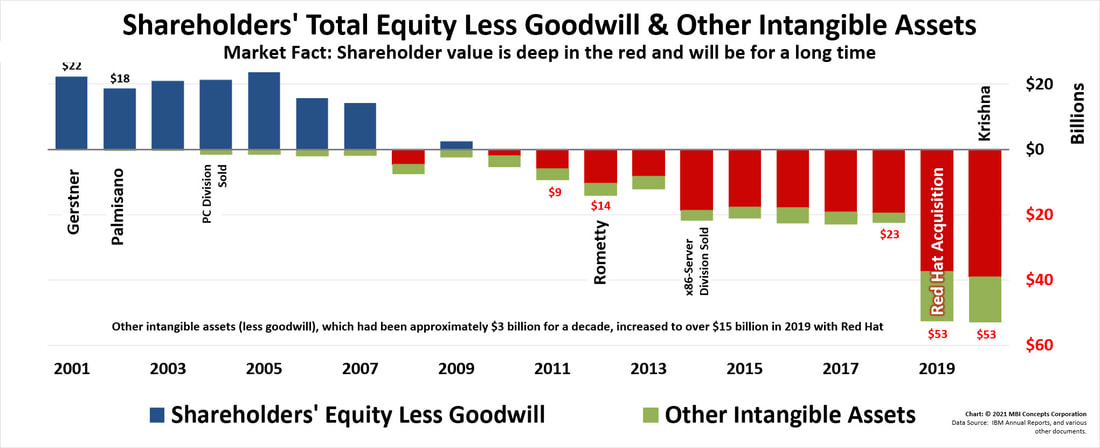
Of the $88 billion paid for its 192 acquisitions since 2001, $62 billion is still carried today as goodwill—more than 70% of all acquisition dollars. This goodwill carries no inherent value and, in a worst-case scenario such as bankruptcy, it would have little or no monetary value.
Therefore, an increasing percentage of goodwill increases shareholder risk. And yes, the goodwill from the 2002 PwCC acquisition is still on the books. These charts start in 2001 because that is when a change was made that allows a company to carry goodwill … effectively forever (writing cynically but close to the truth).
Arvind Krishna's First-Year Shareholder Risk by the Numbers
- Krishna 2020 Shareholder Risk: Flat
- Krishna & Rometty 2012–20 Shareholder Risk: Up Significantly
- Krishna, Rometty, Palmisano & Gerstner 2000–20 Shareholder Risk:
- Goodwill accumulated through 192 acquisitions at a total cost of $88 billion has been increasing shareholder risk
- The percentage of goodwill and intangible assets, with its associated shareholder risk, hasn’t been this high since the corporation was known as the C‑T‑R Company


